Download
1 / 46
500 likes | 702 Views
Risk Measurement in Insurance. Paul Kaye. CAS 2005 Spring Meeting Phoenix, Arizona 17 May 2005. Company ABC. Made up of 3 similar risk portfolios A, B and C Premium 100 Expenses 25 Losses mean 65, std dev 20 (LogNormal) Loss behaviour of A and B highly correlated, C uncorrelated

E N D
Risk Measurement in Insurance Paul Kaye CAS 2005 Spring Meeting Phoenix, Arizona 17 May 2005
Company ABC • Made up of 3 similar risk portfolios A, B and C • Premium 100 • Expenses 25 • Losses mean 65, std dev 20 (LogNormal) • Loss behaviour of A and B highly correlated, C uncorrelated • One year simulation with 100,000 trials • Net underwriting result captured for • ABC (mean +30) • A • B • C
Aims Bring clarity to the risk measurement jungle • Illustrate how risk can be measured • Illustrate how risk can be allocated across sub-portfolios • Highlight the benefits and pitfalls of different approaches • Theory • Practice • Avoid getting unnecessarily technical • Economic value focus
BIG ASSUMPTIONS! • All the risks relevant to the question in hand are in the model • Or at least a way of making an allowance for omissions has been established • The individual model assumptions are valid • The key risk inter-dependencies are incorporated • The design and execution of the model are robust
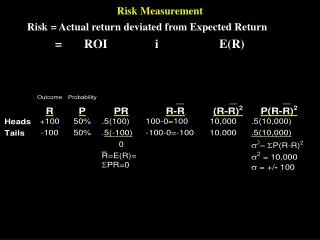
Coherence A risk should measure…err…risk!
Evaluation of methods • Does the chosen risk measure adequately measure risk? • Does the allocation methodology satisfy all relevant stakeholders? • Concept of Coherence formalises common sense behaviour criteria • Coherence of risk measure (Artzner et al) • Coherence of allocation method (Denault) An allocation method will not be Coherent if the Risk Measure chosen is not at least Coherent
Properties of Coherent Risk Measures • Sub-additivity Combining two portfolios should not create more risk • Monotonicity If a portfolio is always worth more than another (i.e. for all return periods), it cannot be riskier • Positive homogeneity Scaling a portfolio by a constant will change the risk by the same proportion • Translation invariance Adding a risk free portfolio to an existing portfolio creates no change in risk
Category 1 Point measures
Point measures • The value of a distribution of outcomes at a single point
Point measures Either • Value at a specified percentile • e.g. 1st/99th %ile (= 1 in 100) or • Probability less than / more than specified value • e.g. 1% chance of a loss of 98.4 or worse for ABC
Point measures - technical Not coherent - fails sub-additivity test! For example, consider 2 similar (non correlating) portfolios: • Up to and including 99.1th percentile value +10 • Beyond 99.1th percentile value -100 • 1 in 100 result: • Sum of parts: +20 • Combined: -90 Problem areas include: • Risk margin when pricing excess of loss reinsurance contracts • Observed in practice with cat modelling results
Point measures - practice Despite technical limitations we love them! • Everyone understands them (don’t they?) • Intuitively easy • Only need to know (or estimate) one point on a distribution to use - the easiest ‘risk’ measure • Popular with regulators … but beware of the limitations
Category 2 Standard deviation and higher moments
Standard deviation and higher moments • Probability weighted deviation from mean
Std deviation and higher moments - theory • Standard deviation limited to giving measure of spread • But does take into account entire distribution • Full description of distributions requires reference to higher moments • E.g. Skewness and Kurtosis • Immediate elegance of a single metric lost • Algebraically cumbersome • Not coherent – fails Monotonicity test
Std deviation and higher moments - practice • Standard deviation is popular but often abused • The school text book measure of volatility • An abstract concept – do users really understand its values? • Insurance distributions are never Normal! • Neither are many financial risk distributions ‘Quick and dirty’ merits should not be ignored but be careful!
Category 3 Expected exceedence measures
Expected exceedence measures • Measures based on the expected result given the result is beyond a given threshold • i.e. the average of all the values beyond a given point of the distribution. Measures include: • Tail Conditional Expectation (TCE) • Tail Value at Risk (TVaR) – same as TCE • Excess Tail Value at Risk (XTVaR) – threshold is the mean • Expected Shortfall (the shortfall beyond the threshold) • Expected Policyholder Deficit (the shortfall beyond the available capital
Expected exceedence measures • TCE2.728% / TVAR2.728%
Expected exceedence - theory • Strong technical properties - coherent • Focuses on one tail of the distribution • Much richer than a simple point measure • But what about the other tail? • All points beyond threshold carry equal weight
Expected exceedence - practice • Intuitively appealing • Consider a 1 in 100 threshold • Point measure: result of X or worse every 100 years • Expected exceedence: expected result Y every 100 years • Need to understand behaviour of full tail of distribution • Calculations easy using computer simulation Popular – strong properties but accessible
Category 4 Transform measures
Transform measures • Mean of transformed distribution (or the difference between this and the original mean) Two ways of going about the transform: • Transform percentiles • E.g. Proportional Hazard Transform (PHT) and Wang Transforms • Transform results • E.g. Concentration charge (Mango) • Note exceedence measures are a very specific form of result transform
Proportional Hazard Transform • PHT5.1375
Proportional Hazard Transform • PHT5.1375
Concentration Charge • Possible weights: *8 if <0 and *4 if >100, otherwise *1
Transform measures - theory • Strong technical properties - coherent • Transforming percentiles is equivalent to transforming results • In both cases giving different weights to different outcomes
Transform measures - practice • Where do the weights come from and what do they mean? • Percentile transforms: • Weights generated buy the transform • But abstract. Why – other than as a means to an end? • Concentration charge style weights: • Rationale for setting weights? • Mango’s ‘Capital Hotel’ analogy • Relatively easy to calculate using scenario based simulation Excellent measures but will the punters understand?
Category 5 Performance ratios
Expected Result Probability of downside * Expected result given downside Probability of upside * Expected result given upside Probability of downside * Expected result given downside Performance ratios • Performance rather than merely risk focused • Risk Coverage Ratio (aka R2R – Reward to Risk)† † Downside: PV < 0 • Omega function‡ ‡ For any threshold
Omega function • Omega value based on threshold of the mean (always 1)
Omega function • Omega values based on full range of thresholds
Omega function • Introduce a new distribution – more volatile but higher mean
Omega function • Introduce a new distribution – more volatile but higher mean
Performance measures – theory and practice • The technical properties of any performance ratio will depend on its construct and its purpose • The Risk Coverage Ratio and Omega function are constructed from measures which have strong technical properties • Complex to explain despite relatively simple foundations • The value isn’t a profit or loss, rather a semi-abstract hybrid • Upside and downside characteristics brought together in an elegant way • Again, relatively easy to calculate using scenario based simulation
Properties of Coherent Allocation Methods • No undercut The allocation for a sub-portfolio (or coalition of sub-portfolios) should be no greater than if it was considered separately • A sub-portfolio’s allocation <= standalone capital requirement • A sub-portfolio’s allocation >= marginal (last in) allocation • Symmetry If the risk of two sub-portfolios is the same (as measured by the risk measure), the allocation should be the same for each • Riskless allocation Cash in a sub-portfolio reduces allocation accordingly
Independent “first in” • Focus on “1 in 100” deviation from mean for ease (128.4 for whole portfolio for all measures) • Allocate to each sub-portfolio on standalone basis • Scale to tie in with overall portfolio measure? Under-rewards diversification Aggregating portfolios not penalised Not coherent
Marginal “last in” • The additional ‘risk’ for incorporating each sub-portfolio • Scale to tie in with overall portfolio measure? Over-rewards diversification Not coherent
Shapley values • The average of the “first in”, “second in”… and “last in” • Coherent (with coherent risk measure) • although doesn’t deal with fractions of portfolios consistently • A computational nightmare! • Elegant algebraic simplification if variance used as risk measure (not coherent!)
Aumann-Shapley • Represents the rate of increase in the risk/capital allocation • i.e. how much additional overall risk comes from a sub-portfolio for a tiny increase in size • Easy to calculate from a scenario based simulation • What weight was applied to each scenario in the calculation of the overall measure? • What contribution was made by each sub-portfolio in each scenario? • Coherent (with a coherent risk measure)
Risk measurement in practice • Avoid all non-coherent risk measures? • Not necessarily but… • Be aware of the limitations • Consider more than one measure and/or tolerance level? • Beyond risk measurement theory… • How relevant is a risk measure to the decision being made? • Do the decision-makers understand the risk measurement information? • What if risk behaviours are poorly captured or not included in the model in the first place?!
Advice from Albert Einstein • "Things should be made as simple as possible, but not any simpler.” • "Not everything that counts can be counted, and not everything that can be counted counts." • "Anyone who has never made a mistake has never tried anything new.”