Download

1 / 34
340 likes | 533 Views
Visuals. N. Buffonge. graphics contains— drawings, diagrams, photographs, illustrations of all sorts, tables, pie charts, bar charts, line graphs, flow charts, and so on.

E N D
Visuals N. Buffonge
graphics contains— drawings, diagrams, photographs, illustrations of all sorts, tables, pie charts, bar charts, line graphs, flow charts, and so on. • producing graphics is not such a terrible task — in fact, it's fun. You don't have to be a professional graphics artist or technical draftsperson to produce graphics for your technical writing. There are ways to produce professional-looking graphics with tape, scissors, white-out, and a decent photocopying machine.
Graphics — an overview • Objects — If you're describing a fuel-injection system, you'll probably need a drawing or diagram of the thing. If you are explaining how to graft a fruit tree, you'll need some illustrations of how that task is done. Photographs, drawings, diagrams, and schematics are the types of graphics that show objects.
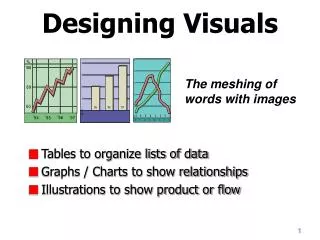
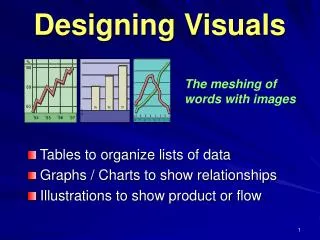
Numbers • Numbers — If you're discussing the rising cost of housing in Austin, you could use a table with the columns being for five-year periods since 1970; the rows could be for different types of housing. You could show the same data in the form of bar charts, pie charts, or line graphs. Tables, bar charts, pie charts, and line graphs are some of the principal ways to show numerical data.
Concept • Concepts — If you want to show how your company is organized, the relationships of the different departments and officials, you could set up an organization chart-boxes and circles connected with lines that show how everything is hierarchically arranged and related. This would be an example of a graphic for a concept: this type depicts nonphysical, conceptual things and their relationships.
Words • Words — And finally graphics are used to depict words. You've probably noticed how textbooks put key definitions in a box, maybe with different color. The same can be done with key points or extended examples. Not the sexiest form of graphics, but it still qualifies, and it's good to keep in mind as a useful technique in certain situations.
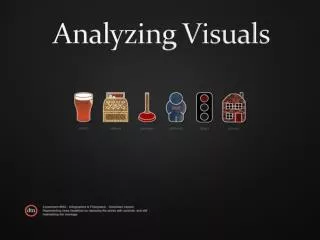
Drawings, diagrams, photos • To depict objects, place, people and relationships between them, you can use photos, drawings, diagrams, and schematics.
Uses of illustrations and photos. In the realm of illustrations and photographs, the types run from minimal detail to maximal. • A simple line drawing of how to graft a fruit tree reduces the detail to simple lines representing the hands, the tools, the graft stock, and graft. :
Diagrams are a more abstract, schematic view of things, for example, a wiring diagram of a clock radio; it hardly resembles the actual physical thing at all. And of course photographs provide the most detail of all. These graphics, supplying gradations of detail as they do, have their varying uses. Here are some examples
instructions, simple drawings (often called line drawings because they use just lines, without other detail such as shading) are the most common. They simplify the situation and the objects so that the reader can focus on the key details.
In descriptions, you would want to use drawings, but in this case drawings with more detail, such as shading and depth perspectives.
In feasibility, recommendation, and evaluation reports, photographs are often used. For example, if you are recommending a photocopier, you might want to include photos of the leading contenders.
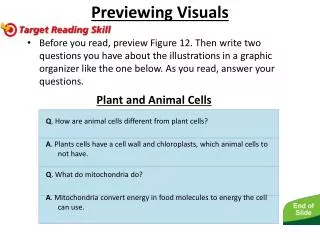
Formatting requirements • Formatting requirements. When you use an illustration in a report, there are several requirements to keep in mind (most of these are shown in the schematic illustration):
Labels — Just about any illustration should contain labels — words and phrases — with pointers to the parts of the things being depicted.
Keys — If the illustration has certain shadings, colors, line styles, or other such details that have a special meaning in the illustration, these should be indicated in a key — an area in an unused corner of the illustration that deciphers their meaning.
Titles — Except in special cases, illustrations should have titles, and these titles should be numbered (Figure 1, Figure 2, and so on). The exceptions are these: if you have lots of illustrations (for example, in certain instructions, there are illustrations practically after every paragraph) and if there is no benefit from the titles; if you only have one or two illustrations and they are not cross-referenced; if you do not cross-reference your illustrations. In some of these cases, you might want to keep the title but discard the word "Figure" and the number following it.
Cross-references — Almost all illustrations should be referred to from the relevant point in the discussion. And, do more than just tossing in a "(See Figure 2.)"; discuss the illustration a bit — focus readers' attention on the key details of the illustration.
Location within the report — Ideally, you place illustrations just after the point where they are needed. However, sometimes because of the pagination (the way the text falls on the pages) and the size of the illustrations, this close placement is not possible. No problem — just put the illustration at the top of the next page; that is what the figure-numbering system is for.
Size of illustrations — Again, ideally, you want illustrations to be between one-half to one-quarter of the vertical size of the page. You want them to fit on the page with other text. In fact, that's what you really want — to merge text and graphics in a report.
What you do not want is to add the illustration to the back of the report! When you have a large illustration, use a photocopier to reduce it.
Placement within margins — Make sure that your illustrations fit neatly and comfortably within standard margins. You don't want the illustration spilling over into the right or left margins. You want to allow the equivalent of at least 2 blank lines above and below the illustration.
Producing illustrations. • Photocopying • Scanning • clip art • Hand-drawing
General guidelines for graphics — a review • Use graphics whenever they would normally be necessary — don't wimp out because it seems like too much trouble! But at the same time, don't get hung up about creating perfect graphics (photocopies work just fine for our purposes as long as you cite your source). This course is a writing course, not a graphic-arts course.
Always discuss graphics in nearby text preceding the graphic. Don't just throw a graphic out there unexplained. Orient readers to the graphic; explain its basic meaning.
If a certain graphic is difficult to produce, discuss the problem with your instructor (you might be able to leave a blank with a descriptive note in the middle). Make sure your graphics are appropriate to your audience, subject matter, and purpose — don't zap beginners with advanced, highly technical graphics they can't understand.
mix graphics and text on the same page. Don't put graphics on pages by themselves; don't attach them to the end of documents.
Use figure titles for graphics (only a few exceptions to this rule). Indicate the source of any graphic you have borrowed — this includes tables, illustrations, charts, and graphs.
Whenever you borrow a graphic from some other source, document that fact in the figure title.
Include identifying detail such as illustration labels, axis labels, keys, and so on. But don't hand-write them in — use the labels from the original photocopy or type them.
Make sure graphics fit within normal margins — if they don't, enlarge or reduce the copies. Leave at least 2 blank lines above and below graphics. When you tape graphics in to your report, photocopy your entire report, not just the pages on which the tape-ins occur. Hand in the entire photocopied document, not the original and not a mixture of original and photocopied pages.
Don't manually add color or other detail on the pages of the final copy that you intend to submit — in other words, don't draw on the final copy. Any details like these should be added before photocopying.
If you must have color, use color photocopying equipment. Place graphics as near to the point in the text where they are relevant as is reasonable. However, if a graphic does not fit properly on one page, put it at the top of the next, and continue with regular text on the preceding page. Don't leave half a page blank just to keep a graphic near the text it is associated with.
Except for graphics that need no figure title, cross-reference all graphics from the appropriate text. In the cross-reference, give the figure number (figure title and page are optional), indicate the subject matter of the graphic, and provide explanatory information as necessary.