Download
1 / 3
30 likes | 144 Views
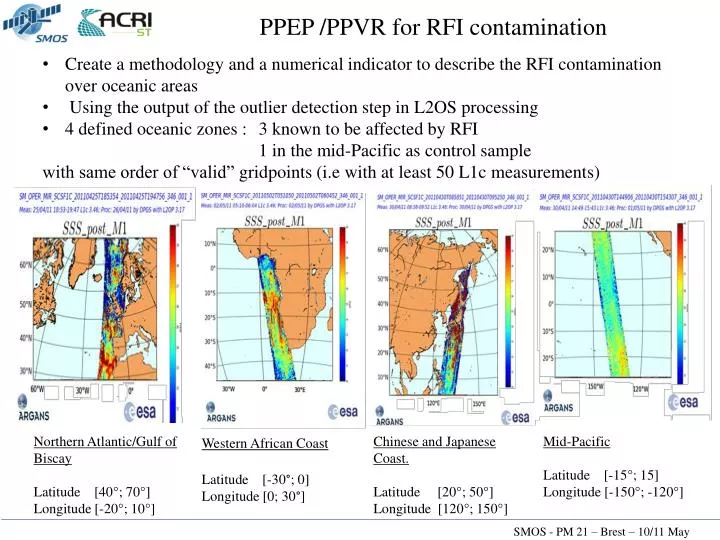
Create a methodology and a numerical indicator to describe the RFI contamination over oceanic areas Using the output of the outlier detection step in L2OS processing 4 defined oceanic zones : 3 known to be affected by RFI 1 in the mid-Pacific as control sample

E N D
Create a methodology and a numerical indicator to describe the RFI contamination over oceanic areas • Using the output of the outlier detection step in L2OS processing • 4 defined oceanic zones : 3 known to be affected by RFI 1 in the mid-Pacific as control sample • with same order of “valid” gridpoints (i.e with at least 50 L1c measurements) PPEP /PPVR for RFI contamination SMOS - PM 21 – Brest – 10/11 May
Methodology : From the most recent half-orbits acquired above these zones • Extract from the DAP, for each gridpoint: the number of outliers’ measurements Dg_num_outlier the number of avalaible measurements Dg_num_meas_l1c • Compute the percentage of outliers’ measurements for gridpoints associated with at least 50 L1c measurements • Focuse on the proportion of gridpoints with more than 20% of outliers’ measurements : proportion of these gridpoints extent of RFI contamination SMOS - PM 21 – Brest – 10/11 May