Download
1 / 39
390 likes | 512 Views
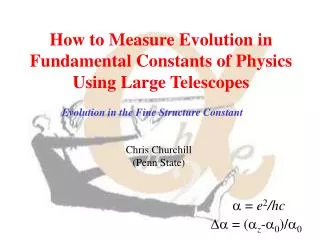
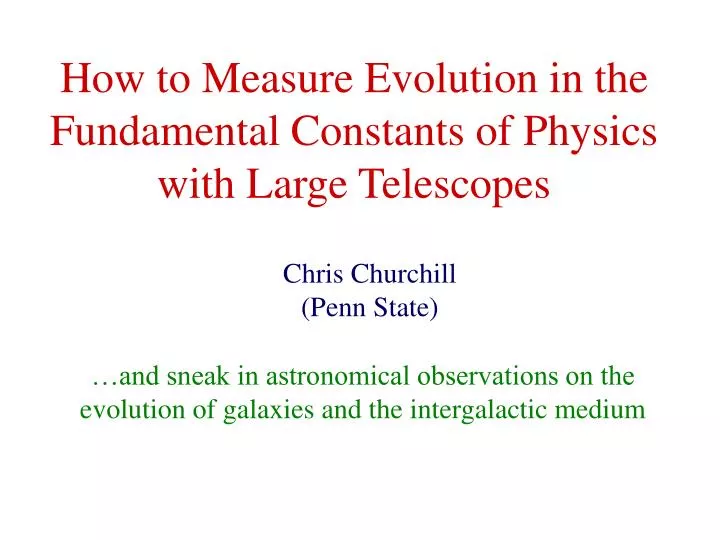
How to Measure Evolution in the Fundamental Constants of Physics with Large Telescopes. Chris Churchill (Penn State). …and sneak in astronomical observations on the evolution of galaxies and the intergalactic medium. Executive Summary. Motivations CMB/BBN And the Winner is…QALs

E N D
How to Measure Evolution in the Fundamental Constants of Physics with Large Telescopes Chris Churchill (Penn State) …and sneak in astronomical observations on the evolution of galaxies and the intergalactic medium
Executive Summary • Motivations • CMB/BBN • And the Winner is…QALs • Fine Structure Constant • Electron-Proton Mass • Bread and Butter Astronomy • Concluding Remarks
Classes of Theories • Multi-dimensional and String Theories • Scalar Theories (varying electron charge) • Varying Speed of Light Theories Unification of quantum gravity with other forces… Couples E+M to cosmological mass density… Modified Bekenstein theories… Attempts to solve some cosmological problems…
Fundamental “Constants” that are ripe for investigation… Da/a = (dlz/dlo-1)/ 2 dl=Dl/l • a = e2/hc • x = a2gp/m • y = a2gp • m= mp/me Dx/x = (zopt – z21)/(1+z) Dy/y = (zmol – z21)/(1+z) zi = zo + bKi b = (1 + zo) Dm/m
CMB Behavior and Constraints Smaller a delays epoch of last scattering and results in first peak at larger scales (smaller l) and suppressed second peak due to larger baryon to photon density ratio. Last scattering vs. z CMB spectrum vs. l Solid (da=0); Dashed (da=-0.05); dotted (da=+0.05) (Battye etal 2000)
BBN Behavior and Constraints D, 3He, 4He, 7Li abundances depend upon baryon fraction, Wb. Changing a changes Wb by changing p-n mass difference and Coulomb barrier. Avelino etal claim no statistical significance for a changed a from neither the CMB nor BBN data. They refute the “cosmic concordance” results of Battye etal, who claim that da=-0.05 is favored by CMB data. (Avelino etal 2001)
QSO Absorption Lines (history) QSO absorption line methods can sample huge time span Savedoff (1965) used doublet separations of emission lines from galaxies to search for a evolution (first cosmological setting) Bahcall, Sargent & Schmidt (1967) used alkali-doublet (AD) separations seen in absorption in QSO spectra.
The Many-Multiplet Method wz= redshifted wave number wz = w0 + q1x + q2y w0 = rest-frame wave number q1, q2 = relativistic correction coefficients for Z and e- configuration x = (az/a0)2 - 1 y = (az/a0)4 - 1 Mg II 2803 Mg II 2796 Fe II 2600 Fe II 2586 Fe II 2382 Fe II 2374 Fe II 2344
Relative Shifts of Large Shifters for Da/a=+10-4 SIMULATIONS…. HIRES/Keck resolution and pixel sampling rate, infinite signal to noise Black lines are unshifted data. Red lines are shifted for Da/a= +10-4. Fe II shifts to blue by ~10(1+Da/a)2 times that of Mg II, though each Fe II has a unique shift magnitude. Cr II shifts to red compared to Si II and Zn II shifts blue as compared to Si II, also with different shift magnitudes
Webb et al Results • 49 absorption cloud systems over redshifts 0.5–3.5 toward 28 QSOs compared to lab wavelengths for many transitions • 2 different data sets; • low-z (Mg II, Mg I, Fe II) • high-z (Si II, Cr II, Zn II, Ni II, Al II, Al III) • Find Da/a = (–0.72±0.18) × 10-5 (4.1s) (statistical) • Most important systematic errors are atmospheric dispersion (differential stretching of spectra) and isotopic abundance evolution (Mg & Si; slight shifting in transition wavelengths) • Correction for systematic errors yields stronger a evolution
Da/a = (–0.72±0.18) × 10-5 (4.1s) (statistical) (Webb etal 2001)
Soon to the Press Preliminary Findings… Now have a grand total of 138 systems due to adding the HIRES data of Sargent et al. Find Da/a = (–0.65±0.11) × 10-5 (6s) (statistical)
The Future Same and new systems observed with different instruments and reduced/analyzed by different software and people. Build UVES/VLT and HRS/HET data base in order to reproduce the HIRES/Keck results Raid STIS/HST archive (already done) to perform the study at z=0 (in Galactic HVCs).
Measuring y=gpa2/m and y=gpa2 Evolution is Problematic The line of sight probed by 21-cm may not be the same probed by the QSO! (Murphy etal 2001) Carilli etal (2001) attempt to minimize this using VLBI for 21 cm.
Measuring m=mp/me is a simple matter of finding damped Ly-alpha systems with hydrogen molecules! Not so easy, only five known to date. Combining 2 QSOs, Ivanchik etal (2002) find Dm/m = (5.7 +/- 3.8) x 10-5 At z=3. Searching with Sara Ellison (ESO) and Max Pettini (IoA) using CORALS (Potekhin etal 1998)
Vibrational and Rotational states of H2 have different m dependence! This is parameterized using sensitivity coefficients, K. Ki = dln(li)/dln(m) Simple linear regression zi = zo + bKi b = (1 + zo) Dm/m (Potekhin etal 1998) Though Potekhin etal (1998) and Ivanchik etal (2002) have placed excellent limits on Dm/m, a zero redshift calibration would be useful to check that the sensitivity coefficients are not systematically influencing the results.
The photodissociation regions of Galactic reflection nebulae show strong H2 emissions lines. These emission lines can be used to place z=0 constraints on Dm/m. This has never been tried, but is in principle straight forward and favorable in that reflection nebulae are abundant (good stats). (Martini etal 2000) The phoenix on Gemini-S is ideally suited for this… R=50,000 and a signal to noise of 30/pixel on a K=12 object in 1 hour (in the continuum)!!
Cooling Flow Galaxies exhibit strong H2 emission lines! Seven CF galaxies known to date with H2 emission. Redshifts are in the range 0.05 to 0.15. Kinematics of gas (~500 km/s) may be a problem, but experience with all gas is that the lower the ionization level, the smaller the physical size and the narrower the profiles. Thus, it is expected that these features will break up into multiple narrow velocity components. Exploring this with Alexander Delgarno (CfA) (Falcke etal 1998)
A uniform and high quality library of QSO Spectra can be fully exploited to learn many fundamental properties of the high redshift universe. • Kinematic, chemical, and ionization conditions of galactic gas and of the Lyman alpha forest. • Evolution in number per unit redshift (number density X cross section) • Detailed photo-ionization modeling yields chemical evolution and size constraints • Directly probe inter-galactic and galactic conditions to highest redshifts Mg II absorbers are ideal - associated with galaxies and with Lyman alpha forest clouds… charts first generation of stars in all environments…
We require high resolution spectra… (Churchill 1997)
Predicted for a decade to not exist… these spectra were peppered with “weak” systems…. (Churchill et al 1999; Rigby etal 2002)
The kinematics of the “Strong” Systems (Churchill & Vogt 2001)
Establishing Direct Connection with Galaxies • Note weak systems are not identified with galaxies • Strong systems typically within 40 kpc of QSO line of sight A pilot project in which the stellar rotation curves of five z=1 edge-on spiral galaxies were measured with LRIS/Keck revealed that the absorption traces the disk kinematics far out into the halo (Steidel etal 2002). We are currently extending this project to 30 galaxies with HST imaging, high resolution absorption line data, and stellar rotation curves (spirals) or velocity dispersions (ellipticals).
Interpreting Complex Absorption Line Profiles Each absorption line arises from an individual cloud with some line-of-sight velocity. Complex profiles are blends of many clouds that are distributed in some geometric/kinematic arrangement(s) in and/or near normal bright galaxies. Simple models of galactic disk geometry and kinematics and of “halo” geometry and kinematics are statistically consistent with the observed complex profiles. (Charlton & Churchill 1996, 1998; Churchill & Vogt 2001)
State of the Mg II Union (Churchill & Charlton 2002)
HRS (z = 0.6-2.2) and JCAM (z = 2.2-3.8) on HET (Churchill & Charlton 2002)
JCAM/HET Commissioning Data R=11,000 ~ 28 km/s J=12 t=2500 sec ~1.15 mm
The Future • Continue Da/a work in collaboration with UVES/VLT and bring in HRS/HET. Long term (10 years)- independent work at R=120,000 with HRS! • Independently measure Da/a in Galactic HVCs using STIS/HST archival data • Measure Dm/m in Galactic reflection nebulae (need pilot) and eventually in cooling flow galaxies to z=0.2. This is H2 emission line work. Search for high-z DLAs with H2 molecules and measure Dm/m in absorption to z=3-4. • Extend studies of Mg II kinematics, chemical, and ionization conditions to z~4 with UVES/HRS/JCAM • Continue establishing kinematic connections with Mg II absorption and stellar kinematics; establish nature of “weak” systems.
Varying Electron Charge Theories Variation occurs over matter dominated epoch of the universe. L r g (Barrow etal 2001)
Varying Speed of Light Theories Motivation is to solve the “flatness” and “horizon” problems of cosmology generated by inflation theory (Barrow 1999; Moffat 2001). Theory allows variation in a to be ~10-5H0 at redshift z=1. Evolution is proportional to ratio of radiation to matter density.