Download
1 / 25
250 likes | 346 Views
Carbon Emissions and Climate Change. A Study of Attitudes and their Relationship with Travel Behavior. Prepared for: TRB National Transportation Planning Applications Conference. Research Questions. Do drivers know what vehicle carbon emissions are?

E N D
Carbon Emissions and Climate Change A Study of Attitudes and their Relationship with Travel Behavior Prepared for: TRB National Transportation Planning Applications Conference
Research Questions Do drivers know what vehicle carbon emissions are? What are driver’s opinions about a link between carbon emissions from vehicles and climate change? Are drivers likely to change travel behavior to reduce carbon emissions? Do drivers support policies such as using toll revenue to implement carbon emission reduction programs?
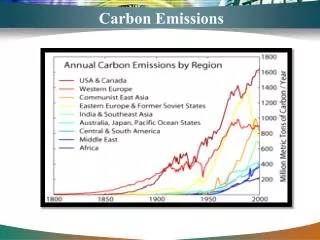
Context Sources of US GHG Emissions, MMT CDE, by Sector, 2007 US Transport Sector, CO2 Emissions, 1947-2007 ~2% CAGR Source: Emissions of Greenhouse Gases in the United States 2007 (DOE/EIA-0573(2007)), 3 Dec. 2008
Context Source: Global Warming on the Road: The Climate Impact of America’s Automobiles Environmental Defense 2006
Policy • “To have the greatest chance to slow and perhaps even reverse the slide toward calamitous climate change, we need to mobilize the widest possible public support for effective actions. And to do this effectively, we need to understand the bases of public attitudes and behavior.” Source: PUBLIC ATTITUDES AND BEHAVIOR ABOUT CLIMATE CHANGE: What Shapes Them and How to Influence Them, Martin Patchen, 2006
Attitude Towards Climate Change • Belief is most strongly held by: • Urban residents • Younger people • More educated people Source: A Deeper Partisan Divide Over Global Warming The Pew Research Center for the People and the Press, 2008
Behavioral Attitude Towards Climate Change • “There is consistent evidence that people’s willingness to take specific environmentally-helpful actions or support specific pro-environmental policies declines as the amount of sacrifice connected to the action or policy increases.” • “A study of Americans also found that people were much more likely to support policies that had no clear costs to them personally.” • 90 % believe the U.S. should reduce GHG emissions • 77% support CO2 regulations • 54% support a 5% gas guzzler tax on vehicles < 25mpg • 17% support a 60 cent/gallon gas tax to encourage people to drive less and reduce emissions. Source: PUBLIC ATTITUDES AND BEHAVIOR ABOUT CLIMATE CHANGE: What Shapes Them and How to Influence Them, Martin Patchen, 2006
Attitudinal Segmentation of the UK Populations ‘Believe but busy’ believe climate change is happening but feel that they are unable to act because they have other priorities ‘Contributors’ are prepared to take action because they believe that small actions by many people will have an impact on climate change. ‘Deniers’ are skeptical that human activity impacts climate change. May be motivated by cost and time saving arguments but not by environmental considerations. ‘Ineffectuals’, believe that climate change is happening but do not believe that their actions will make a difference. ‘Aspirationals’ are younger people, who are relatively well educated about climate change but who have lifestyle aspirations that deter them from taking actions that will reduce their carbon consumption. Source: Exploring public attitudes to climate change and travel choices: deliberative research (King et al, 2009)
Project Locations Chicago, IL July 2008 Norfolk, VA May 2009 Dallas, TX December 2008 Dothan, AL June 2008 Austin, TX May 2008
Computer-based stated preference surveys Designed to estimate the values of travel time savings (VOTs) of potential users of road pricing projects Multi-method sampling approach In-person intercept at activity sites near the study corridor Hand-out/mail-out postcard invitations Employer emails Online sample providers Survey Methodology
General Questionnaire Outline RP Trip Characteristics Stated Preference Debrief and Attitudes Demographics • Questions describing respondent’s recent trip in the corridor • E.g. purpose, time of day, origin, destination, etc. • Stated preference trade-off questions presenting various travel alternatives under different time and cost conditions • Toll attitude questions • Emissions attitude questions • Basic individual and household-level demographic information, such as gender, age, employment, household size, household vehicles, annual household income
Three toll attitude statements: I will use a toll route if the tolls are reasonable and I save time. I support using tolls to pay for highway improvements that relieve congestion. I can generally afford to pay tolls. Five climate/emissions attitude statements: I understand what vehicle carbon emissions are. Carbon emissions from my vehicle contribute to climate change. I am willing to carpool or take public transit more frequently to reduce carbon emissions from my vehicle. I am willing to pay higher tolls if they are used to reduce air pollution and carbon emissions. I support using tolls to pay for public transportation. Five point scale from “strongly disagree” to “strongly agree” Attitude Statements
Attitude Analysis • A few disclaimers: • Preliminary work • Stated preference samples are not necessarily population-proportional • Not all questions included in all surveys for various reasons • These are “add-on” questions to a stated preference survey
Overall Attitudes I will use a toll route if the tolls are reasonable and I save time. Toll Attitudes I support using tolls to pay for highway improvements that relieve congestion. I can generally afford to pay tolls. I understand what vehicle carbon emissions are. Carbon emissions from my vehicle contribute to climate change. I am willing to carpool or take public transit more frequently to reduce carbon emissions from my vehicle. Emission Attitudes I am willing to pay higher tolls if they are used to reduce air pollution and carbon emissions. I support using tolls to pay for public transportation.
Toll Attitudes Survey Location • Higher toll acceptance in Chicago and Dothan • Lower toll acceptance in Norfolk Percent Agree Household Income Household Income • Household income is strongly associated with toll attitudes
Toll Attitudes • Higher toll acceptance • Older • Employed full-time or retired • Less toll acceptance among students and unemployed • No significant differences found between other demographic variables, including • Household size • Household vehicles • Gender Respondent Age Employment Status
Emission Attitudes: Understanding Emissions I understand what vehicle carbon emissions are. • Very little variation across other demographic variables. • Essentially all respondents reported having an understanding of vehicle carbon emissions Percent Agree Household Income Increases slightly with income Age Lowest age category least likely to understand
Emission Attitudes: Contribute to Climate Change Carbon emissions from my vehicle contribute to climate change. Percent Agree Decreases as age increases; similar to Pew study findings Age Gender Women more likely to agree More household vehicles less likely to agree Household Vehicles Employment Status Students more likely to agree Survey Location Austin and Chicago more likely to agree; Dothan and Norfolk less
Emission Attitudes: Willing to Change Behavior I am willing to carpool or take public transit more frequently to reduce carbon emissions from my vehicle. Percent Agree Decreases as income increases Household Income Decreases as age increases Age Decreases as number of household vehicles increases Household Vehicles Students most willing to change behavior Employment Status Large differences by region
Emission Attitudes: Willingness to Pay I am willing to pay higher tolls if they are used to reduce air pollution and carbon emissions. Percent Agree Household Income Almost no variation by income, compared with large variation in willingness to pay for travel time savings Gender Women more willing to pay to reduce emissions Household Vehicles Decreases as number of household vehicles increases Employment Status
Emission Attitudes: Tolls for Transit I support using tolls to pay for public transportation. Percent Agree High income households more likely to support using tolls for transit Household Income Household Vehicles Decreases as number of household vehicles increases Survey Location
Latent Class Analysis Cluster Sizes • Latent Class Analysis was used to group respondents into clusters based on their responses to the toll and emission attitude questions. • Probability-based classification into unknown groups • Homogenous groups of respondents who share similar attitudes Percent Agree > Average < Average * Not used as an input variable to the latent class analysis
Cluster 1: “I’ll pay for anything that benefits me directly” Willing to pay to save time. Can afford to pay tolls. Don’t believe they are contributing to climate change and don’t want to do anything about it. Cluster Characteristics: Higher than average income Slightly older Skews male Latent Class Descriptions • Cluster 2: “I’ll do anything to reduce my impact” • Willing to pay to save time. • Can afford to pay tolls. • Believe they are contributing to climate change and willing to pay more and change behavior to reduce impact • Cluster Characteristics: • Slightly higher income • Fewer household vehicles • Skews female • Cluster 3: “ I don’t believe in climate change or double taxation.” • Not willing to pay to save time. • Can’t afford to pay tolls. • Don’t believe they are contributing to climate change and don’t want to do anything about it. • Cluster Characteristics • Slightly lower income • More household vehicles • More likely to be from the Norfolk Sample • Cluster 4: “I’d like to reduce my impact, but I can’t afford it” • Not willing to pay to save time. • Can’t afford to pay tolls. • Believe they are contributing to climate change and willing to shift behavior, but not pay extra • Cluster Characteristics: • Lower income • Younger • More students • Skews female
Conclusions • Vast majority of respondents are aware that their vehicles emit carbon, but only slightly more than half think this is contributing to climate change. Even fewer are willing to change their behavior or pay to reduce emissions. Support decreases as personal sacrifice increases. • Many people are willing to pay for something that directly benefits them, such as saving travel time, but fewer are willing to pay for something less tangible such as emissions reduction. • Distinct attitudinal groups exist. What is the best way to market policy initiatives to each group? • How do you get ~50% of the population (clusters 1 and 3) to agree that climate change is an issue? • How do you get them to care enough to do something about it? • More research is needed!