Download
1 / 27
270 likes | 484 Views
Complex Networks and Dynamics: Communicability and Cycle Centrality network forensics - desktop NAACSOS2009 Doug White, UCI, Inst. of Math. Beh. Sci., and SFI. 2009 NAACSOS conference, ASU October 23-24 MU 228: Cochise Friday, 8:30 am the 23 rd

E N D
Complex Networks and Dynamics: Communicability and Cycle Centralitynetwork forensics - desktop NAACSOS2009Doug White, UCI, Inst. of Math. Beh. Sci., and SFI 2009 NAACSOS conference, ASU October 23-24 MU 228: Cochise Friday, 8:30 am the 23rd With credits to Nataŝa Kejžar and James McNemar
My approach to social science and simulation is something like a forensic scientist: what’s the trail of causality?Who done it? Part I Challenge question: Adding forensic probes to simulation to challenge explanations – e.g. social circles model of complex networks Part II Structural forensics – empirical example Conflictual splitting - Social dynamics Structural cohesion Communicability and community detection: subgroup centrality and spectral decomposition (Estrada indices) Shredding your models / Embedding new ones
Adding forensic probes to simulation(Challenge question) • Simulations generate networks through interactions • To understand outcomes, define the nodes that interact and code the network as it evolves. Save the data for the evolving networks. Do longitudinal networks analysis for each run, i.e., what are the mechanisms (not just the parameters) that cause the results? (not an easy but a challenging problem) • e.g. social circles model of complex networks (White, Kejžar, Tsallis, Farmer, White 2006).
My question of interest is Given some generating biases (in this case, activity bias, smartness of nodes in transmission (preferential attachment), and distance decay Can we detect these in the evolving network signatures (e.g., motifs and network measures)? And how does interaction between these biases alter those signatures?
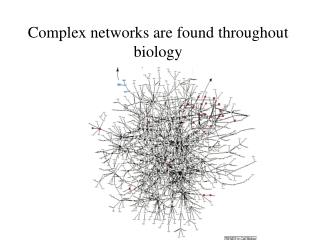
social circles model of complex networkshttp://eclectic.ss.uci.edu/~drwhite/EBMsim/500-0-1d9-0x002.htm • "Generative Model for Feedback Networks" in Physical Review E, 016119 (2006, Douglas R. White, Nataša Kejžar, Constantino Tsallis, J. Doyne Farmer, Scott D. White. 2005 SFI working paper 05-08-034 (simulation in Python) (Reviewed 2005 in Europhysicsnews 36(6):218-220 by Stefan Thurner) • Wikipedia:Social circles network model • e.g., Might use statnet (ergm) to see how structural features evolve.
The hubs aspect is similar to James Fowler’s (in-degree, transitivity, and betweenness centrality) “attract and introduce” model of the heritable components of social networks
http://eclectic.ss.uci.edu/~drwhite/EBMsim/500-0-1d9-0x002.htmhttp://eclectic.ss.uci.edu/~drwhite/EBMsim/500-0-1d9-0x002.htm red=reciprocated arcs (20 steps each) RND activity RND intermediaries 1/distSQ
Classes of Results with common characteristics As a function of activity exponent α= how much does frequency of present behavior generate a higher probability of he same behavior? α = 0 random behavior α = 1 power-law behavior
that governs the degree distribution curves on activity α, dist-decay ß and smart hubsγ on activity α, dist-decay ß and smart hubs γ Note the effect of smart hubs γon q.
Node weighting Path weighting
Network features examined through time (feedback simulation model) • Nataša Kejžar’s thesis looked at these: • indegree distributions for directed edges (smart nodes pick up preferential attachmnt) • outdegree distributions for undirected edges (ditto; directed preferential activity) • shortest paths distributions (picks up preferential attachment) • densification of edges relative to nodes (rising with n but av. low) • Other properties that might be examined are • node centrality distributions and graph centralities • betweenness • closeness • flow • Eigenvalue • component and k-component size distributions • clustering coefficient distributions • emergence of giant bicomponent • variation in path length distributions • transitivity • reciprocity • triad census • degree correlations (assortativity) • searchability: whether hub search outperforms random search (Adamic et al.) • self-similarity • statnet fitting (ergm) subgraph centrality – will discuss today • Estrada community structure - will discuss These kinds of network properties can be the simulation probes
Tracing of motifs, however, is limited in measures of ergm, triad census, etc. E.g., Would like to know if “size of clusters” grows, what defines the clusters, how changing structures are generated – WHO DONE IT? Wikipedia:Structural cohesion – a good measure of cohesion, extensive (size of subgroup) and intensive (its strength of cohesion) K-core percolation, k-clique percolation, etc. – also useful Community detection and size – but no agreement how to measure
My approach to social science and simulation is something like a forensic scientist: what’s the trail of causality?Who done it? Part II Structural forensics for a Karate club Conflictual splitting - Social str & dynamics Structural cohesion (2001, 2003) Communicability and community detection: subgroup centrality and spectral decomposition (Estrada indices, 2005, 2009)
Conflictual splitting - Social structure & dynamics The competitive split here is between a karate club instructor (1) and his club administrator (34). Where will they split? Will (1) take only his exclusive clients with him? Or will (1) try to take some of the administrator’s “group”? (34)’s Friends of friends?)
White and Harary, in The Cohesiveness of Blocks in Social Networks: Node Connectivity and Conditional Density. Sociological Methodology 2001:305-359… Forensic network dynamics the exact order in which links were dissolved in the club were predicted from structural cohesion of club membrs to 1) the teacher or 34) the administrator, or when tied, to the one closer in path distances. The arrows show choices by those linked to both leaders, as predicted by shorter paths (3 links to 10 but 10 does not choose sides)
Structural cohesion alone doesn’t predict the splitting order Forensic network dynamics Named cohesive blocking by White and Harary 2001, also “structural cohesion” as resistance-to-taking-a-group apart and “path cohesion” as stick-togetherness (definitions 1.1.2. and 1.2.2), the Menger theorem (1927) shows these definitions to be equivalent. Programmed by Moody and White (2003) in SAS and by Peter McMahan in R using igraph. note (3 – 28 not 9) (3 – 10 not 31) (InterSci wiki)
Forensic network dynamics (cycle density) 2005 Estrada & Rodriguez’ Subgraph centrality in Complex Networks. Phys. Rev. E But Estrada’s subgraph centrality does predict splitting order (1) & (34) are highest in subgraph centralities Larger nodes in more Cs cycles Estrada’s communities match the White-Harary predictions but link 3 & 10 as a separate “overlapping” community.
is 2009 Estrada and Hatano’s Communicability Graph and Community Structures in Complex Networks. Phys. Rev. E 77 036111. A = adj. matrix. Forensic network dynamics Spectral decomposition: the 3-10 pair are one of three overlapping communities
Communicability and community detection: parallel to (Estrada ) subgroup centrality but based on structural holes not cycles • Something like a cross between SVD scaling and spring embedding but based on spectral decomposition • Potentially overlapping community detection • But may work only for simpler networks because there is decomposition by sign of eigenvalues structural holes i≠j = i=j cycles (structural cohesion)
Whats the good of all this? • Small world models are very common but So What? The “model(s)” predict they are supposed to be common (clustering plus a small amount of randomness → relatively small shorts path distances. You can’t help but get that result -- so what’s the surprise?) • More impt. are the “shortcuts” crossing structural holes: longer cycles. • The Karate club has 45 triangles (3-cycles), 36 4-cycles, 20 5-cycles, 2 6-cycles and none longer. Two triangles are between factions (1-3-9 & 3-39-9). Of the triangles, 96% are within factions while between factions are 94% of the 4-cycles, 90% of the 5-cycles, and 100% of the 6-cycles. That tells us it is the triangles that are the glue within the karate club factions, not the longer cycles. • This is not the case in other networks I have studied forensically. • The density of 3- and 4-cliques is also greater for the teacher than the administrator (3 3-cliques for the teacher 2 for the administrator).
What’s the import of longer cycles? • How impt. are the “shortcuts” crossing structural holes: the longer cycles. • Is Estrada useful in identifying the place of “longer cycles” which are not the unions of shorter cycles, i.e., when you combine two independent cycles (each with a distinct edge) but delete lines in common, you get another cycle. • The Karate club has only 41 independent cycles but 45 + 36 + 20 + 2 cycles overall, 58 cycles of length greater than 3: It is conceivable that those 58 longer cycles (or 41 of the longest cycles) are sufficient to generate all the cycles of the network. There are in fact 51 longer cycles (longer than 3) that cross between the factions • We can identify those cycles, and can show that various sets of 41 independent cycles do generate all the other cycles in the network. • That casts a different light on network structure. Is it local clusters with crossovers? Or long cycles that generate local structure? That becomes an interesting statistical question. ERG (statnet) models do not deal with that.
Have I managed to shred: • Small world models as irrelevant to network forensics (“a” footprint does not mean its “your” footprint) • Triad censuses (the subset of people on the block does not necessarily contain the killer). • ERG models that favor local structure (the killer is not necessarily someone close) • And of course its not preferential attachment (largely shredded long ago). So put some network probes in your simulation: THE END • And pay attention to complexity
Have I managed to shred: • Small world models as irrelevant to network forensics (“a” footprint does not mean its “your” footprint) • Triad censuses (the subset of people on the block does not necessarily contain the killer). • ERG models favor local structure (the killer is not necessarily someone close) • And of course its not preferential attachment (largely shredded long ago). So put some network probes in your simulation: • And pay attention to complexity