Download
1 / 70
720 likes | 857 Views
Master Teacher in Economics Fundamentals Module. James B. Wilcox Resources provided by: The University of Southern Mississippi Center for Economic and Entrepreneurship Education, Mississippi State University, & Virtual Economics. MTE Course Overview. Five In-Person Modules

E N D
Master Teacher in EconomicsFundamentals Module James B. Wilcox Resources provided by: The University of Southern Mississippi Center for Economic and Entrepreneurship Education, Mississippi State University, & Virtual Economics
MTE Course Overview • Five In-Person Modules • Fundamental Economics • Microeconomics • Macroeconomics • International Economics • Personal Finance Economics • Class Format • Lecture & Discussion • Sample Lessons • Assessment MTE Class #1 - Fundamentals
Lesson Plans for Today MTE Class #1 - Fundamentals
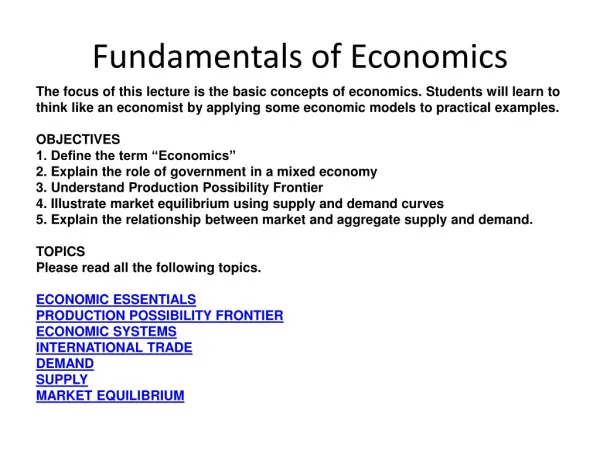
Economics… is the study of how individuals and society choose, with or without the use of money, to employ scarce productive resources to produce various commodities over time and distribute them for consumption, now and in the future, among various people and groups in a society.
Guide to Economic Reasoning • People choose. • The choices people make involve costs. • People respond to incentives in predictable ways. • People create economic systems that influence individual choices and incentives. • People gain when they trade voluntarily. • People’s choices have consequences that lie in the future. MTE Class #1 - Fundamentals
TASK • You have one kidney to distribute. • You have to select one patient to receive a kidney transplant. • All suffer from urgent need. • The patients not chosen will die within the year • Be prepared to discuss the merits of your decision– • Why did you choose the person your group decided upon • Why did you pass up each of the others (to die)
CRITERIA • Person’s merit • Contribution to society (past or potential) • Ability to pay • Their need • Their age
Patient Profile • Patient #1: Dr. M. • 45 year old physician with large inner-city practice • Had mild heart attack 3 years ago, but made good recovery and heart seems sound • No wife or children • Present yearly income: $70,000 • Potential lifetime earnings: $994,095 • Has health insurance
Patient Profile • Patient #2: Bonnie T. • 24 year old mother of two children • Active in community work, Red Cross, and church • Plans to resume nursing career when children reach school age (4 years) • Present yearly income: $32,000 (husband’s income) • Potential lifetime earnings: $327,003 • Has health insurance
Patient Profile • Patient #3: Fred S. • 3rd year medical student, doing well and considered “of great promise” by his advisors • Plans to specialize in neurology • Father of one child and another on the way • Present yearly income: $10,000 • Potential lifetime earnings: $1,149,812 • Has health insurance
Patient Profile • Patient #4: Agnes M. • 26 year old mother of two children, abandoned by husband • Unable to work because of lack of affordable daycare facilities in area • Presently on welfare • Active in church, tenant’s organization in her building and welfare rights organization • Present yearly income: $6,996 (public aid and food stamps) • Potential lifetime earnings: $121,425 • Has Medicaid
Patient Profile • Patient #5: Ellen R. • 20 year old college junior, suffering from hereditary condition; family fears twin sister has same disease • Doing excellent work in college; has been accepted to law school • Present yearly income: $47,000 (parents’ income) • Potential lifetime earnings: $928,753 • Has health insurance
Future: Dr. M Dies of a massive coronary attack 2 years after receiving the transplant
Future: Bonnie T. Goes back to school and becomes an obstetrician.
Future: Fred Drops out of medical school and leaves his wife
Future: Agnes M Wins the lottery and volunteers time and money to children’s hospital programs
Future: Ellen R. Becomes a lawyer and spends career defending the poor
Opportunity Cost • Opportunity cost of a chosen activity is the value of the best alternative that is forgone • Similar to opportunity lost • Focuses on the alternatives associated with making choices • Opportunity cost is subjective • Only the individual making the choice can select the most attractive alternative • Chooser seldom knows the actual value of the “road not taken”
Opportunity Cost • Time is the ultimate constraint • By pursuing one activity, we cannot at the same time do something else each activity undertaken has an opportunity cost • May vary with circumstances • Depends on the value of the alternatives • Monetary cost • May be a reasonable approximation but can omit the time involved which may be substantial for some activities
Production Possibilities Frontier • Focus is on how much an economy can produce with a given set of resources and technology What are the economy’s production capabilities?
Production Possibilities Frontier • Identifies the various possible combinations of the two types of goods that can be produced when all available resources are employed fully and efficiently • No change increases the production of one good without decreasing the production of the other good • Involves getting the maximum possible output from available resources
Factors that can Shift the PPF • Changes in Resource Availability • Increases / Improvements in Quality rightward shift • Decreases /Reductions in Quality leftward shift • Increases in the Capital Stock • Increases rightward shift • Decreases leftward shift • Technological Change • Employs available resources more efficiently
Exhibit 2a: Shifts in the Economy’s PPF • All of the following would lead to a rightward shift in the PPF from A to A‘: • Increase in the size or health of the labor force • Improvement in the skills of the labor force • Increases in the amount of capital • Decreases in any of the above factors would shift the PPF from A' to A shift to the left • The parallel shift implies the change that occurred affected the production of both goods equally
Exhibit 2b: Shifts in the Economy’s PPF • A leftward shift from A to A" could be caused by any of the following: • Decrease in the size or health of the labor force • Decline in the skills of the labor force • Decreases in the amount of capital • The parallel shift implies the change that occurred affected the production of both goods equally
Lessons of PPF • Efficiency PPF represents the combinations of output that are possible, given the economy’s resources and technology • Scarcity Given the stock of resources and technology, the economy can produce only so much • Economic Growth rightward shift or rotation of PPF • Choice • The PPF does not tell us what we SHOULD produce.
Activity MTE Class #1 - Fundamentals
Law of Demand • Says that quantity demanded varies inversely with price, other things constant • The higher the price, the smaller the quantity demanded • The lower the price, the larger the quantity demanded
Substitution Effect • When the price of a good falls, its relative price makes consumers more willing to purchase this good • When the price of a good increases, its relative price makes consumers less willing to purchase this good • Changes in the relative prices – the price of one good compared to the prices of other goods – causes the substitution effect
Income Effect • Money income • Number of dollars received per period of time • Real income • Income measured in terms of the goods and services it can buy • When the price of a good decreases, real income increases • When the price of a good increases, real income declines
(b) Demand Curve $18 a $15 $12 b Price per Pizza $9 c $6 d $3 e $0 8 14 20 26 32 Millions of Pizzas per week Exhibit 1: Demand Schedule & Demand Curve for Pizza The demand schedule lists possible prices, along with quantity demanded at each price. The demand curve at the right shows each price / quantity combination listed in the demand schedule as a point on the demand curve.
Demand and Quantity Demanded • Demand for pizza is not a specific quantity, but rather the entire relation between price and quantity demanded, and is represented by the entire demand curve • An individual point on the demand curve shows the quantity demanded at a particular price. • The movement from say, b to c, is a change in quantity demanded and is represented by a movement along the demand curve and can only be caused by a change in price a $15.00 t r a b 12.00 u q r e c 9.00 p e c i d r 6.00 P e 3.00 D 0 8 14 20 26 32 Millions of pizzas per week
Shifts of the Demand Curve • Demand curve focuses on the relationship between the price of a good and the quantity demanded when other factors that could affect demand remain unchanged • Money income of consumers • Prices of related goods • Consumer expectations • Number and composition of consumers in the market • Consumer tastes
Exhibit 2: Increase in the Market Demand • Suppose income increases: some consumers will now be able to buy more pizza at each price market demand increases demand shifts to the right from D to D' • A decrease in demand will mean demand shifts to the left from D' to D. $15 b f 12 Price 9 6 D' 3 D 0 8 14 20 26 32 Millions of pizzas per week
Changes in Consumer Income • Goods can be classified into two broad categories: • Normal goods: the demand increases when income increases and decreases when income decreases • Inferior goods: the demand decreases when income increases and increases when income decreases
Changes in the Prices of Related Goods • Prices of other goods are another of the factors assumed constant along a given demand curve • Two general relationships • Two goods are substitutes if an increase in the price of one shifts the demand for the other rightward and, conversely, if a decrease in the price of one shifts the demand for the other good leftward • Two goods are complements if an increase in the price of one shifts the demand for the other leftward and a decrease in the price of one shifts the demand for the other rightward
Changes in Consumer Expectations • If individuals expect income to increase in the future, current demand increases and vice versa • If individuals expect prices to increase in the future, current demand increases and decreases if future prices are expected to decrease
Activity MTE Class #1 - Fundamentals
Supply • Supply indicates how much of a good producers are willing and able to offer for sale per period at each possible price, other things constant • Law of supply states that the quantity supplied is usually directly related to its price, other things constant • The lower the price, the smaller the quantity supplied • The higher the price, the greater the quantity supplied
Exhibit 3: Supply Schedule & Supply Curve S Price $15 12 • The supply curve and the supply schedule both show quantities of pizza supplied per week at various prices by all the pizza makers in the market • Price and quantity supplied are directly, or positively, related: producers offer more for sale at higher prices than at lower ones: Supply curve slopes upward 9 6 3 0 12 16 20 24 28 Millions of pizzas per week
Supply and Quantity Supplied • Supply refers to the relation between the price and quantity supplied as reflected by the supply schedule or the supply curve • Quantity supplied refers to a particular amount offered for sale at a particular price, a particular point on a given supply curve
Shifts of the Supply Curve • Determinants of supply other than the price of the good • State of technology • Prices of relevant resources • Prices of alternative goods • Producer expectations • Number of producers in the market
Exhibit 4: Change in Technology Can Mean an Increase in Supply • A more efficient technology, a high-tech oven, is invented • Production costs fall suppliers will be more willing and more able to supply the good rightward shift of the supply curve from S to S'. • Result: more is supplied at each possible price S S' $15.00 g h 12.00 9.00 Price per quart 6.00 3.00 0 12 16 20 24 28 Millions of pizzas per week
Changes in the Prices of Relevant Resources • Resources that are employed in the production of the good in question • For example, if the price of mozzarella cheese falls, the cost of pizza production declines • Conversely, if the price of some relevant resource increases, supply decreases
Prices of Alternative Goods • Alternative goods are those that use some of the same resources employed to produce the good under consideration • For example, as the price of bread increases, so does the opportunity cost of producing pizza and the supply of pizza declines • Conversely, a fall in the price of an alternative good makes pizza production more profitable and supply increases
Changes in Producer Expectations • When a good can be easily stored, expecting future prices to be higher may reduce current supply • More generally, any change expected to affect future profitability could shift the supply curve
Number of Producers • Since market supply sums the amounts supplied at each price by all producers, the market supply depends on the number of producers in the market • If that number increases, supply increases • If the number of producers decreases, supply decreases