Download
1 / 24
240 likes | 469 Views
Damage Detection in a Simple Shear Beam Model: Modal Analysis and Seismic Interferometry. Vanessa Heckman Monica Kohler Tom Heaton May 25, 2012 University of Memphis. Overview. Modeling a building as a continuous beam Seismic Interferometry of UCLA Factor Building

E N D
Damage Detection in a Simple Shear Beam Model: Modal Analysis and Seismic Interferometry Vanessa Heckman Monica Kohler Tom Heaton May 25, 2012 University of Memphis
Overview • Modeling a building as a continuous beam • Seismic Interferometry of UCLA Factor Building • Experimental Analysis Using Uniform Shear Model
Flexible Building as a Continuous Cantilevered Beam • Dynamic motions of a continuous beam can provide insight into the deformation of buildings. • Example: MRF • If the building is considered as a continuum, it would often be anisotropic. • Stiffness associated with inter-story drift (ε13 and ε23) much less than the stiffness associated with shearing the actual floor slabs (ε12). • Stiffness associated with extension along columns (ε33) is different than for extension along the floor slabs (ε11 and ε22). • Assume that only parts of the strain tensor which are important to describe the deformation of the building are inter-story shear strain and extensional strain along the columns. • Can thus approximate the building as being isotropic, since the other elastic moduli are not important. • Heaton, T. CE 151 Class Material, 2010.
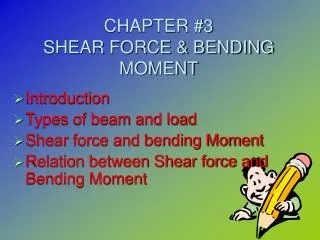
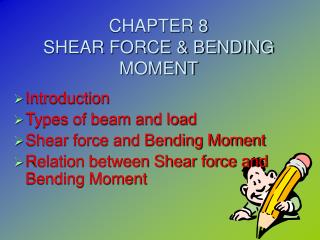
Shear Beam • Whenthe groundbeneath the buildingmoveshorizontally, thisisidentical to the problem of havingan SH wavepropagatevertically in a layer of building; the bendingisapproximately zero in thiscase. • Total stiffnessagainstshearisequal to the shearmodulustimes the cross sectionalarea. • Whileactualbuildingsareneither a truebendingbeam nor a shearbeam, we cangainsomeusefulinsight by lookingattheseapproximatemodes of deformation. • It is identical to the problem of a vertically propagating SH wave in a plate with a rigid boundary at the bottom and a free boundary at the top. • Heaton, T. CE 151 Class Material, 2010.
Shear Beam • Solution to this problem can be written as a sum of reflecting pulses. The motion in the building is given by u1g(t) Horizontal motion of the ground at the base of the building c = β = Shear wave velocity in the building • Drift isgiven by • Base of the building: zerodisplacement, double the drift • Top of the building: zero drift, double the displacement • Sequencerepeatswithperiodicity 4h/c, whichis the fundamentalperiod of the building oscillation. • Heaton, T. CE 151 Class Material, 2010.
Shear Beam • Mode Shapes for the first four modes • Natural Frequencies
Background: UCLA Factor Building • UCLA Factor Building • 17-story, moment-resisting steel-frame structure • Embedded 72-channel accelerometer array • N-S modal frequencies: 0.59 Hz, 1.8 Hz, 3.1 Hz (1:3:5 ratio for shear beam) • E-W modal frequencies: 0.55 Hz, 1.6 Hz, 2.8 Hz (1:3:5 ratio for shear beam) • Experimental data and numerical model (ETABS) • Kohler, M. Heaton, T., Bradford, C. 2007. BSSA.
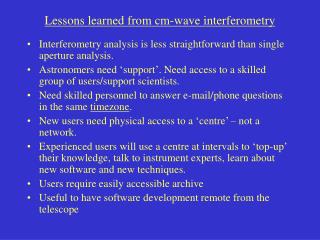
Background: UCLA Factor Building Experimental Hammer Test • Impulse Response Function • Deconvolution is used to extract the transfer function • Bandpass filtered between 0.5 Hz and 10 Hz • Stack over small EQs to stay in linear response • Shear beam: waves travel nondispersivelythroughout the lower floors of the building (v = ~160 m/sec) • For bending beams, the waves would disperse with the wave velocity increasing as the square root of the frequency Impulse Response Functions • Kohler, M., Heaton, T., Bradford, C. 2007. BSSA.
Laboratory Example: Uniform Shear Beam • Experimental Setup • Five-story uniform shear model • Piezoelectric accelerometers, DAQ • Force transducer hammer • Shake table, signal generator • Damaged/undamaged configuration
Laboratory Example: Uniform Shear Beam • Consider the structure modeled by a multi-degree-of-freedom system • Compute constants m, k from mass, geometry, and material properties • m: Mass of each floor • k: Stiffness due to bending plate (column) • Determine the mode shapes and frequenciesof the system from the eigenvalues and eigenvectors of M-1K • Damping is found experimentally • 1st mode: logarithmic decrement method • Higher modes: half-power bandwidth method • Neglected: ζn< 0.005, n = 1,…,5 • Kohler, M., CE 181 Class Notes, 2010.
MDOF System • Transfer function used to find mode shapes • Relates the response at DOF k to simple harmonic excitation at DOF m kth component of the rth mode shape modal damping frequency of the rth mode • Consider the transfer function at the rth modal frequency • Kohler, M., CE 181 Class Notes, 2010.
Damping Coefficient Logarithmic Decrement Method • 1st Mode damping ratio • Free vibration • Half-Power Bandwidth Method • Higher Mode damping ratio • Based on the response of a SDOF system, but can be used for MDOF system as long as there is no coupling between the modes • Can be problems obtaining low damping ratio due to freq resolution
Mode Shapes, Frequencies, and Wave Propagation • Calculated vs. Observed: Good agreement • Damage: Introduced at the 4th floor • Damaged vs. Undamaged • Significant decrease in frequencies • Changes in mode shapes • Changes in wave propagation
SH Plane Waves transmitted • Ray Path Diagram • Continuous displacements • Continuous tractions • Reflection/Transmission Coefficients • Vertical incidence • Fixed Surface: Rss = -1 • Free Surface: Rss = 1 • Higher to Lower Velocity/Stiffness: Rss > 0; Tss > 1 θT β2< β1 β2=sqrt(μ2/ρ2) x1 β1=sqrt(μ1/ρ1) θR θI incident reflected x3 • Heaton, T. CE 151 Class Material, 2010.
Seismic Interferometry • Seismic interferometry may aid in damage detection by comparing post-event waveforms with pre-event waveforms • Changes in wave speed • Floor-to-floor reflections • Forward modeling using a numerical model (ETABS) will be used to test the application to civil structures Impulse Response Function • Kohler, M., Heaton, T., Bradford, C. 2007. BSSA. • Hayashi, Y., Sugino, M., Yamada, M., Takiyama, N., Onisha, Y. 2012. STESSA
Acknowledgements • Thomas Heaton, Professor of Seismology, Caltech • Dr. Monica Kohler, Researcher, Caltech • Ming HeiCheng, PhD Candidate, Caltech • Rob Clayton, Professor of Geophysics, Caltech • Hartley Fellowship • Housner Fund
Thank you! Questions?
Seismic Interferometry • Cross-Correlation of Ambient Noise vsDeconvolution • Synthetic Example: Simple Shear Beam • D’Alembert Solution • Cross-Correlation • Deconvolution Cross-Correlation Deconvolution IRF
Seismic Interferometry • IRF from Cross-correlation of Ambient Noise • Prieto, G., Lawrence, J..Chung, A., Kohler, M. 2010