Download
1 / 26
270 likes | 405 Views
Perform Grow and Breakout. Presentation to Deutsche Bank Asia Pacific Financial Institutions Conference London, 9-10 July 2001 Peter Marriott Chief Financial Officer Australia and New Zealand Banking Group Limited. ANZ - who we are. One of the ‘Big Four” Australian banks.

E N D
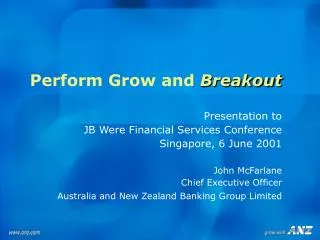
Perform Grow andBreakout Presentation to Deutsche Bank Asia Pacific Financial Institutions Conference London, 9-10 July 2001 Peter Marriott Chief Financial Officer Australia and New Zealand Banking Group Limited
ANZ - who we are • One of the ‘Big Four” Australian banks. • Provider of full range of financial services in Australia (since 1835) and New Zealand (since 1840) • Leadership in Corporate Banking, Credit Cards and Mortgage origination, a strong eCommerce position and an offshore network in Asia and Pacific. • Assets A$181b (US$ 95b) • Market Cap A$24.5b (US$ 12.7b) • Profit (half year) A$895m (US$ 470m) • Staff 22,815 • Credit Ratings AA-/Aa3 ANZ Headquarters 100 Queen Street Melbourne Note: figures as at 31/3/01, with exception of market cap which is as at 28/6/01
We are on track to deliver on our 3 year commitments Measure EPS growth ROE Cost-income ratio Inner Tier 1 Credit rating 2003 Commitment > 10% > 20% mid 40’s 6% maintain AA category Achievement 13% 19.1% 49.4% 6.2% maintained • We have also committed to improving customer satisfaction, and will publicly report our progress
e-Transform Perform Grow & Break out Building for the future - a distinctive strategy • Proposition • Entrepreneurial specialists create more value • Corporations must embrace new technologies • Value depends on performance, growth and breaking out • Strategy • Reconfigure ANZ as a portfolio of 16 specialist businesses • An e-Bank with a human face • Drive results, invest in growth businesses and create new paradigms/culture • Implications • Specialist approach to customer and product businesses • Transform the way we do business with IP technology • Meet expectations, fund growth by cost reduction, transform Specialise
Transforming ANZ through Perform, Grow and Breakout • Focus: long term ‘destiny’ • Benchmark: global industry/players • Looking for: transforming moves • Horizon: 5-10 years • Success: dramatic market cap increase Break out • Focus: specialisation and out-growing the market • Benchmark: competitors in each business • Looking for: breakout moves in key • businesses (eg QTV, Origin) • Horizon: 3-4 years • Success: 4-5 moves taking share and • worth ~AUD1bn+ market cap each Grow • Focus: performance • Benchmark: market expectations • Looking for: six monthly delivery • Horizon: 1-2 years • Success: meet/exceed expectations • consistently Perform
We areperformingwell - interim results • NPAT from continuing operations $907m - up 18% • EPS up 13% to 55.8 cents • ROE of 19.1%, up from 17.8% • Cost Income ratio down to 49.4% • Continuing operations revenue up 10%, costs flat • Credit quality sound: • ELP charge down to 35 bp’s • Total non-accruals down • Specific provisions flat - down overseas and up domestically • Profit on sale of holding in St George $99m ($65m after tax), offset by write downs in investments ($84m) • Improved disclosure - financial information provided for each business unit
Internet banking users as % of main relationships Non-accrual loans Building a strong track record NPAT/ROE Cost to Income $m NPAT $m ROE % % $m % Source: JP Morgan & Roy Morgan Research
Good profit growth across a diversified portfolio Mar 00 v Mar 01 $m Personal Corporate International and subsidiaries
A strong performance culture EVA focus Cost Control • Rigorous Risk v Reward discipline • Driver based capital allocation • Integrated model • Part of culture • Allocation of a scarce resource • Ongoing re-engineering • eTransformation • Activity Value Analysis (AVA) Value Aspirations Strategies Leading Cost Income Ratio EVA targets Business Unit EVA performance Customer Rewards
We continue to actively manage and reduce risk Lending Profile by Asset Type* • Exiting higher risk businesses • More emphasis on lower risk businesses • Corporate balance sheet deliberately constrained – focus on fee income • Risk based approach embedded through EVA business consumer * CBA as at 31/12/00, NAB & WBC as at 30/9/00
Total non-accrual loans continue to fall, but increase in Australia Historic Geographic Gross Non-Accrual Loans $m Gross Non-Accrual Loans (LHS) $m Non-Accrual Loans/ Loans & advances (RHS) Net Non-Accrual Loans (LHS) Aust NZ Inter
Group risk grade profile continues to improve - but some signs of turning domestically $114.6bn $126.5bn $134.9bn $141.0bn AAA to BBB+ BBB to BBB- BB + to BB BB- 5.4% 3.9% > B 7.2% 3.8% ELP (bp’s) 45 43 38 35 >B = B, B-, CCC & non-accrual
Provisioning in line with expectations ….but increasing in Australia and New Zealand $m Actual SP v ELP charge ELP charge SP charge International & Subsidiaries Personal Corporate • Slowing domestic economy likely to increase specific provisions • ELP is a function of volume (on and off balance sheet), risk grade profile, and level of security • Specific Provisions tend to be less volatile in Personal businesses and track more closely to ELP
Provisioning levels remain strong represents 3 years expected losses $m % GP/Lending Assets* ELP charge 241 FX impact 1460 27 1373 (181) Net SP transfer Surplus448 1012 1H 2001 2000 APRA Guidelines ELP - Economic Loss Provision SP - Specific Provision * includes acceptances
We are developing a track record for building growth businesses % % Share of credit card spend Mortgage market share 95 96 97 98 99 00 01 95 96 97 98 99 00 01 m $m % Growing FM inflows Personal customers - Australia FM inflows(LHS) Deposit market share(RHS)
Most businesses’ targeting revenue growth well in excess of expense growth Personal Cards Corporate High Int. & Subsidiaries GFX Private Clients Asia GSF Asset Fin GCM GTS ANZ Investments Pacific Nominal GDP Growth Plan Revenue Growth 01-03 cagr Inst. Bank Small Bus Metro & Reg Banking Mortgages Corporate Cost:Income falling Low ILLUSTRATIVE Low High Plan Operating Expense Growth 01-03 CAGR Note: Bubble size approx. in proportion to 2001 forecast NPAT
We are developing a strong CRM capability CAPABILITIES INFRASTRUCTURE • Enterprise Customer Data Mart (ECDM) • Tran$act database • Customer scoring and decision engine • Behavioural credit scoring systems • Campaign Management System • Interim front line screen delivery • Full account and customer EVA • Segmentation markers and profiles • Propensity-to-buy scores • Application/behavioural scores • Multiple campaign management In Place In Pilot/ Develop- ment • Attrition scores by customer • Recovery scores • Automated, event-based campaigns • Automated prospect list delivery (“My Sales”) • “Optimal” strategy selection by customer (longer term) • Call centre, ATM, and SSP integration • anz.com integration • Multi-product decisioning • Full front line screen delivery
Substantial growth opportunities in Personal • System Growth • Underlying credit growth ~ 8-10% pa • Market Share • Product businesses growing customer numbers and market share • Customer #’s increasing by 1.0m - translates to $650m in additional revenue pa • Increase Wallet • Customer businesses deepening wallet share • $650m revenue gain by matching our peers • Created customer businesses • Sales programs • CRM Total potential revenue growth - $1.5b Customer #’s (m) Peer Average Increased wallet on higher share $160m 10 Potential revenue $650m 7.3 5 4 Potential revenue $650m Existing revenue $2.6b 0 40% 50%* Share of Customer Wallet * Average share of wallet for CBA, NAB, SGB, WBC - source: Roy Morgan Research
In Corporate, our main focus is on growing total wallet share Focus on deeper # Customers penetration of existing • Grow wallet share • New high value products • New delivery mechanisms • Improved cross-sell • Increased sale of 3rd party products CFS customer base Potential revenue ~$1.3b ~5,000 Total wallet FY 2000 revenue of ANZ customer $1.7b base ~$8.5b 0 ~20%* ~35% Share of Customer Wallet * source: internal estimate
Our breakout approach is differentiating us • Specialised businesses - open architecture • First class execution (no surprises) Strategy Staff Customers eTransformation Risk • 91% of managers on individual contracts • 12% rise in staff satisfaction • Breakout cultural change program • Establishment of Customer Charter, Customer Advocate and distinctive customer and community initiatives • Leading cost income ratio • Highest internet banking penetration • Leading financial disclosure & transparency • EVA embedded in culture
Developing a breakout performance culture Mission /aspiration where we are where we want to be Distinctive (Top 10%) Targets/goals Superior (Top 25%) Average Organisational approach BU Performance feedback Consequencemanagement Rewards &recognition Opport- unities People Financial Operational Values + Coordination and control Motivation Average Superior Distinctive * Benchmark - 33 Australasian companies surveyed over 1999-2000
ANZ’s aspiration • A high performing company, exceeding expectations • Revenue growth • Cost leadership • Risk mitigation • EPS • ROE • Positioned in growth markets • Actively managed portfolio • Annual investment in growth ideas • Higher than peer revenue growth Perform Grow AND Breakout • More dynamic than competitors • High P/E rating • Performance culture • Lean and agile • The e-bank with a human face • A breakout mentality
Summary • We are performing well • Cost management momentum – eTransformation has just begun… • Risk reduction continues • Our new strategy is creating value andbetter positioning us for growth • We are differentiating ourselves through our Breakout program We are on track to achieve our goals
The material in this presentation is general background information about the Bank’s activities current at the date of the presentation. It is information given in summary form and does not purport to be complete. It is not intended to be relied upon as advice to investors or potential investors and does not take into account the investment objectives, financial situation or needs of any particular investor. These should be considered, with or without professional advice when deciding if an investment is appropriate. For further information visit www.anz.com or contact Philip Gentry Head of Investor Relations ph: (613) 9273 4185 fax: (613) 9273 4091 e-mail: gentryp@anz.com
Economic outlook - cautiously optimistic Real GDP Growth incl. and excl. housing and Olympics (est) % Financial conditions in Australia more expansionary than US Contractionary Year ended, excluding dwellings and Olympics Expansionary • Retail sales continue to rebound • Housing recovery continues • But unemployment is still rising • Forecast GDP growth for 2001 calendar year - 2%, rising to 4% in 2002 • Unlike the US, Australia did not experience contractionary financial conditions • With domestic growth indicators strengthening, and early signs of rising inflation, the interest rate cycle has likely bottomed
Copy of presentation available on www.anz.com