Download
1 / 8
80 likes | 257 Views
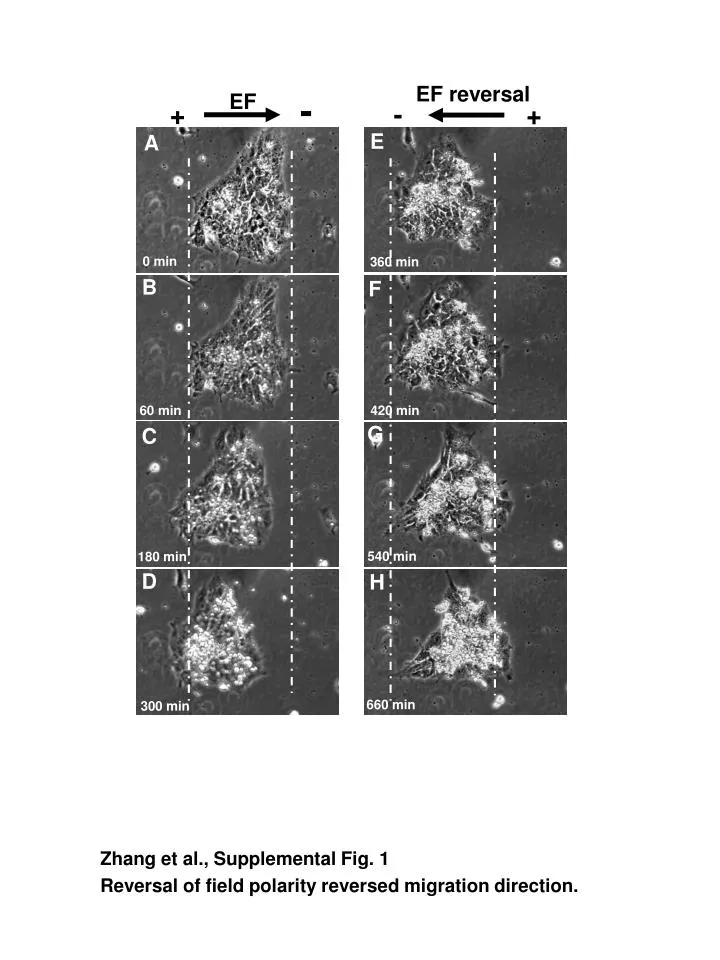
EF reversal. + -. EF. - +. E. A. 360 min. 0 min. B. F. 420 min. 60 min. G. C. 540 min. 180 min. D. H. 660 min. 300 min. Zhang et al., Supplemental Fig. 1 Reversal of field polarity reverse d migration direction. + -. EF. Isolated hiPS cells.

E N D
EF reversal +- EF -+ E A 360 min 0 min B F 420 min 60 min G C 540 min 180 min D H 660 min 300 min Zhang et al., Supplemental Fig. 1 Reversal of field polarity reversed migration direction.
+ - EF Isolated hiPS cells big colony of hiPS cells A E 0 min B F 90 min G C 180 min H D EF EF + - + - Zhang et al., Supplemental Fig. 2 Electrotaxis of an Isolated and a large colony of hiPS cells.
* * * * * * Zhang et al., Supplemental Fig. 3 Displacement along X axis.
A SSEA-4 B Oct-4 C merger Zhang et al. SupplementalFig. 4. Small electric fields did not alter expression of stem cell markers.
C A NO EF + Y- 27632 NO EF B D EF EF+Y-27632 + - + - Zhang et al., supplemental Fig. 5 ROCK inhibition altered cell morphology and induce protrusions in hiPS cells.
100mV/mm NO EF EF + - A 4 1 3 2 4 1 2 3 6 5 5 0 h 0 h 1 4 2 3 4 3 6 2 1 5 3 h 5 3 h C B * * Zhang et al. Supplemental Fig. 6 EFs guide anodal migration of dermal fibroblasts in 2D.A, representative images showing cells migrate anodally when treated with EFs (right panel), as compared to non-EFs treated controls (left panel); B and C, quantitative analysis showing significantly increased directedness (B) and trajectory speed (C) of cells by EFs stimulation. *, P<0.01.
200mV/mm NO EF EF + - A 1 1 2 2 0 h 0 h 1 2 1 2 6 h 6 h C B * * Zhang et al. Supplemental Fig. 7 EFs guide anodal migration of dermal fibroblasts in 3D. A, representative images showing cells migrate anodally in 3D when treated with EFs (right panel), as compared to non-EFs treated controls (left panel); B and C, quantitative analysis showing significantly increased directedness (B) and trajectory speed (C) of cells in 3D by EFs stimulation. *, P<0.01.
50mV/mm 100mV/mm A 0 h 3 h 6 h B C * * * * Zhang et al. Supplemental Fig. 8 Galvanotaxis of hiPS cells in 3D at 50mV/mm and 100mV/mm. A, representative images showing anodal migration of hiPS cells at 50mV/mm (left panel) and 100 mV/mm (right panel); B and C, quantitative analysis showing the directedness (B) and migration speed (C) of hiPS cells at indicated EFs strength. *, P<0.01.
