Download
1 / 40
400 likes | 549 Views
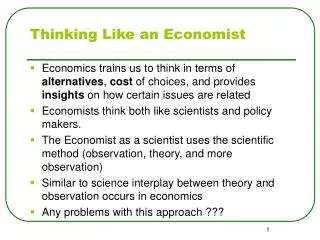
Thinking Like an Economist. Basic Questions: Macro. Macroeconomic Questions How can sufficient growth be attained so that the well being of society increases? How should productive capacity be utilized so that there will be full employment with stable prices?. The Economy as a Circular Flow.

E N D
Basic Questions: Macro • Macroeconomic Questions • How can sufficient growth be attained so that the well being of society increases? • How should productive capacity be utilized so that there will be full employment with stable prices?
The Economy as a Circular Flow Resources Income Firms Households Expenditures Goods and Services
What Is GDP? • GDP, Gross Domestic Product, is the total dollar value of all final goods and services produced in a country during a year. • Current market prices are used to aggregate different outputs to a dollar total. • Government purchases, many of which do not occur in markets, are valued at their cost of production.
What Is GDP? • Only final goods and services are included. Intermediate goods are not included to avoid double counting. • The measure is an annual flow, a rate of production. A GDP of $10 trillion implies that the economy is producing $10 trillion worth of goods and services per year. • GDP measures production by U.S. citizens and foreigners alike inside the geographic borders of the USA and thus unequivocally reflects economic activity in the USA.
Real and Nominal GDP • Nominal GDP • The market value of a nation’s final output based on current prices for the goods and services produced during the year. • Nominal GDP in 2001 = the sum of all the goods and services produced in 2001 multiplied by their 2001 prices • Real GDP • An estimate of the value of a nation’s final products adjusted for changes in prices since some base year.
Components of GDP: Expenditure Viewpoint • Consumption • Non-durable Goods (last less than 3 years) • Durable Goods (last more than 3 years) • Services • Gross Domestic Investment • Non-residential Investment (plant and equipment) • Inventory Change • Residential Investment
Components of GDP: Expenditure Viewpoint • Government Spending • Local and State • Federal • Net Exports • Exports Minus Imports
Components of GDP: Income Viewpoint • Employee Compensation • Income from the sale of labor services during the year. • It includes wages, salaries, and fringe benefits such as employer provided insurance and employer contributions to pension funds.
Components of GDP: Income Viewpoint • Net Interest • The portion of business receipts used to pay for borrowed funds that finance investment purchases. • Rental Income • Rental income is earned by those who supply the services of land, mineral rights, and buildings for use by others.
Components of GDP: Income Viewpoint • Profits. • Profits of corporations and unincorporated business • Profits = Total revenues - Indirect business taxes - Capital consumption allowance - labor costs - net interest - rents paid
Components of GDP: Expenditure and Income • Expenditure • GDP = C + I + G + (X-M) • Income • NI = W + i + R + p • Since NI and GDP measure aggregate production, they must be equal.
GDP = NI 2001 Consumption6,987.1 Durable Goods 835.9 Nondurables 2,041.3 Services4,109.9 Investment1,586.0 Nonresidential 1,201.6 Residential 444.7 Inventory Change-60.3 Government 1,858.0 Federal 628.1 State & Local1,229.9 Net Exports-348.9 Exports 1,034.1 Imports1,383.0 GDP 10,082.2 Employee Compensation 5874.9 Corporate Profits 731.6 Proprietors’ Income 727.9 Net Interest 649.8 Rental Income 137.9 National Income8,122.1 + CCA 1329.3 + Indirect Business Taxes 774.8 + Business Transfers 42.5 - Subsidies -47.3 +Statistical Discrepancy -117.3 GNP10,104.1 +Net Foreign Payments -21.9 GDP10,082.2
The Economy as a Circular Flow Resources Income Firms Households Expenditures Goods and Services
What GDP Is Not • It is not a measure of a nation’s overall welfare. Why? • Some things are produced but never sold and so are not included in GDP. • GDP places no value on leisure • Some expenditures are hidden from data collectors
What GDP Is Not • Production of some goods and services while increasing GDP can have a negative effect on the environment • Some items are included that do not reflect net benefits to society. • Environmental clean-ups bring us back to the pre-damage state. These expenditures are included with no offsetting reduction to reflect the cost of pollution.
Macroeconomic Problems Unemployment Inadequate Growth Inflation
Unemployment • The unemployment rate is the number of unemployed people, expressed as a percentage of the labor force. • Labor Force = (Civilian non-institutional population over age 16 minus people not in the labor force (students, homemakers, retirees, discouraged workers)
Definitions Labor Force = Number of Employed + Number of Unemployed Unemployment Rate = Number of Unemployed Labor Force Labor Force Participation Rate = Labor Force Adult Population X 100 X 100
Types of Unemployment • Frictional Unemployment • Occurs due to normal turnover in the labor market. People changing jobs. • Structural Unemployment • Refers to workers who are not employed because their skills are not in demand. • Cyclical Unemployment • Occurs due to changes in the business cycle.
Natural Rate of Unemployment • The natural rate of unemployment is the percentage of the labor force that can normally be expected to be unemployed for reasons other than cyclical fluctuations in real GDP. • The natural rate of unemployment is related to the willingness of workers to voluntarily separate from their jobs, job loss, the duration of unemployment periods, the rate of change in the pattern of demand, and changes in technology.
Costs of Unemployment • Loss in productivity is measured by the gap between potential GDP and actual GDP. • A conservative estimate of the cumulative gap between actual and potential GDP over the years 1974-1992 (evaluated in 1987 prices) is approximately $1300 billion. • At 1993 levels, this loss in output would be about 3 months’ worth of production.
Inflation • Inflation refers to a sustained rise in the average level of prices. • Inflation does not mean that all prices are rising. Some prices may be falling, but on average the overall level of prices is rising.
Inflation • Creeping inflation is an inflation that proceeds for a long time at a moderate and fairly steady pace. • Galloping inflation is an inflation that proceeds at an exceptionally high rate, often for only a brief period. • In 1993, Brazil experienced inflation rates of 2,700%
The Costs of Inflation • The main cost of inflation is the loss of efficiency that results because inflation distorts price signals. For example… • People invest in assets designed to protect them against inflation, such as real estate, rather than in productive investments that enhance the growth and efficiency of the economy.
The Costs of Inflation • Business collect bills more promptly, using resources that could otherwise have been used to produce goods and services. • Individuals reduce money holdings, which is inconvenient and misallocates the individual’s personal resources of time, energy , and leisure. • In the case of hyperinflation, inflation over 100%, the currency system breaks down and the economy reverts to barter.
Purchasing Power and Inflation • Inflation erodes the purchasing power of a given sum of money. • Assume you have $10,000 and the price level is 1. • In current dollars, you have $10,000, and in constant dollars you have $10,000.
Purchasing Power and Inflation • Now let the price level rise to 2. • In current dollars, you still have $10,000, but in constant dollars you now have ??? ? • The rise in the price level has decreased the purchasing power of your money.
Price Indexes • Consumer Price Index (CPI) • The CPI is calculated by observing changes in the cost of purchasing a typical bundle of consumer goods and services. • The CPI is a weighted average of all prices, with the weights given by the relative importance of different goods or services in the typical bundle of purchases.
Price Indexes • GDP Deflator • The GDP deflator is the ratio of GDP valued at current prices and GDP valued at base year prices. For example, if 1992 is the base year, the GDP deflator is: • (GDP valued in 1999 prices/GDP valued in 1992 prices)100
The GDP Deflator and the CPI • There are 4 major differences between the GDP deflator and the CPI. • The CPI reflects prices of only consumer goods and services: The GDP deflator includes prices of all output.
The GDP Deflator and the CPI • The CPI incorporates prices of imports: The GDP deflator does not. • The CPI is calculated by tracking over time the cost of a fixed basket of goods and services: The GDP deflator allows the output basket to change. • Once published, the CPI is never revised: The GDP deflator changes with GDP revisions.
Which Movies Were Most Profitable? • E.T. • Gone with the Wind • Forrest Gump • Star Wars • Jurassic Park • Empire Strikes Back • The Sting
Movies: Receipts in Current Dollars • E.T. $357.77 • Jurassic Park $354.16 • Forrest Gump $336.38 • Star Wars $273.30 • Empire Strikes Back $200.50 • The Sting $128.67 • Gone with the Wind $ 76.35
Movies: Year Released • The Empire Strikes Back 1980 • Gone with the Wind 1939 • Forrest Gump 1994 • The Sting 1973 • Jurassic Park 1993 • E.T. 1982 • Star Wars 1977
Movies: Adjusted for Inflation • Gone with the Wind $859 • Star Wars $628 • E.T. $552 • The Sting $397 • Jurassic Park $375 • The Empire Strikes Back $361 • Forrest Gump $343 Millions of 1996 Dollars
Movies: Receipts in Constant Dollars • Receipts in $1996 = Nominal receipts x (1996 price level/Year movie released price level). • Gone with the Wind $76.35 x 10⁸/9.61 = $859 • Star Wars $273.3 x 10⁸/47 = $628 • E.T. $357.77 x 10⁸/70 = $552 • The Sting $128.67 x 10⁸/35 = $397 • Jurassic Park $354.16 x 10⁸/102= $375 • Empire Strikes Back $200.5 x 10⁸/60 = $361 • Forrest Gump $333 x 108/105 = $343
Movies: Receipts in Current Dollars • Nominal Receipts = Inflation adjusted receipts x (Year movie released price level/1996 or base price level). • E.T. $552 x 70/108 = $357.77 • Jurassic Park $375 x 102/108 = $354.16 • Forrest Gump $346 x 105/108 = $336.38 • Star Wars $628 x 47/108 = $273.30 • Empire Strikes Back $361 x 60/108 = $200.55 • The Sting $397 x 35/108 = $128.67 • Gone with the Wind $859 x 9.6/108 = $ 76.35
The • End