Download
1 / 1
10 likes | 103 Views
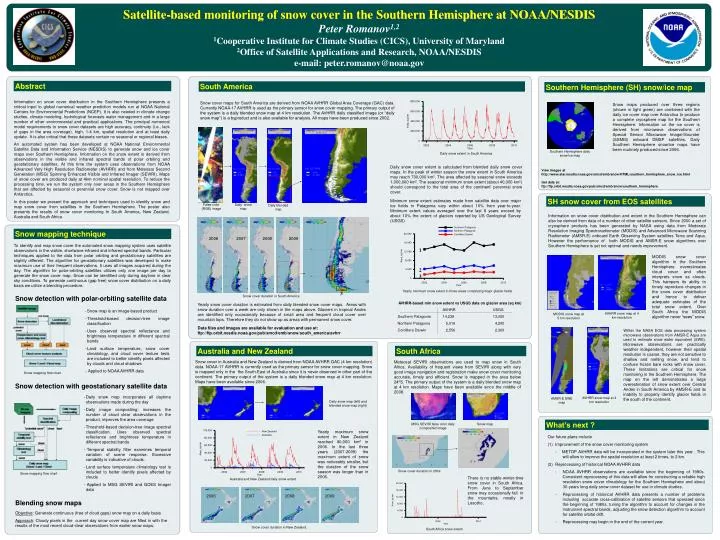
False-color (RGB) image. Daily snow map. Daily blended map. 2007. 2008. 2009. 2006. 1. 2. 2. 1. 3. 3. AVHRR-based min snow extent vs USGS data on glacier area (sq km) AVHRR USGS Southern Patagonia 14,239 13,000 Northern Patagonia 5,019 4,200

E N D
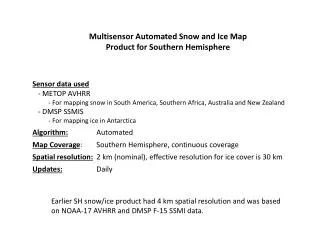
False-color (RGB) image Daily snow map Daily blended map 2007 2008 2009 2006 1 2 2 1 3 3 AVHRR-based min snow extent vs USGS data on glacier area (sq km) AVHRR USGS Southern Patagonia 14,239 13,000 Northern Patagonia 5,019 4,200 Cordillera Darwin 2,556 2,300 Snow mapping flow chart Satellite-based monitoring of snow cover in the Southern Hemisphere at NOAA/NESDIS Peter Romanov1,2 1Cooperative Institute for Climate Studies (CICS), University of Maryland 2Office of Satellite Applications and Research, NOAA/NESDIS e-mail: peter.romanov@noaa.gov Abstract South America Southern Hemisphere (SH) snow/ice map Information on snow cover distribution in the Southern Hemisphere presents a critical input to global numerical weather prediction models run at NOAA National Centers for Environmental Predictions (NCEP). It is also needed in climate change studies, climate modeling, hydrological forecasts water management and in a large number of other environmental and practical applications. The principal numerical model requirements to snow cover datasets are high accuracy, continuity (i.e., lack of gaps in the area coverage), high, 1-4 km, spatial resolution and at least daily update. It is also critical that these datasets contain no seasonal or regional biases. An automated system has been developed at NOAA National Environmental Satellite Data and Information Service (NESDIS) to generate snow and ice cover maps over Southern Hemisphere. Information on the snow extent is derived from observations in the visible and infrared spectral bands of polar orbiting and geostationary satellites. At this time the system uses observations from NOAA Advanced Very High Resolution Radiometer (AVHRR) and from Meteosat Second Generation (MSG) Spinning Enhanced Visible and Infrared Imager (SEVIRI). Maps of snow cover are produced daily at 4km nominal spatial resolution. To reduce the processing time, we run the system only over areas in the Southern Hemisphere that are affected by seasonal or perennial snow cover. Snow is not mapped over Antarctica. In this poster we present the approach and techniques used to identify snow and map snow cover from satellites in the Southern Hemisphere. The poster also presents the results of snow cover monitoring In South America, New Zealand, Australia and South Africa. Snow cover maps for South America are derived from NOAA AVHRR Global Area Coverage (GAC) data. Currently NOAA-17 AVHRR is used as the primary sensor for snow cover mapping. The primary output of the system is a daily blended snow map at 4 km resolution. The AVHRR daily classified image (or “daily snow map”) is a byproduct and is also available for analysis. All maps have been produced since 2002. Snow maps produced over three regions (shown in light green) are combined with the daily ice cover map over Antarctica to produce a complete cryosphere map for the Southern Hemisphere. Information on the ice cover is derived from microwave observations of Special Sensor Microwave Imager/Sounder (SSMIS) onboard DMSP satellites. Daily Southern Hemisphere snow/ice maps have been routinely produced since 2006. Southern Hemisphere daily snow/ice map Daily snow extent in South America Daily snow cover extent is calculated from blended daily snow cover maps. In the peak of winter season the snow extent in South America may reach 700,000 km2. The area affected by seasonal snow exceeds 1,000,000 km2.The seasonal minimum snow extent (about 40,000 km2) should correspond to the total area of the continent’ perennial snow cover. View images at http://www.star.nesdis.noaa.gov/smcd/emb/snow/HTML/southern_hemisphere_snow_ice.html Get data at: ftp://ftp.orbit.nesdis.noaa.gov/pub/smcd/emb/snow/southern_hemisphere SH snow cover from EOS satellites Minimum snow extent estimates made from satellite data over major ice fields in Patagonia vary within about 10% from year-to-year. Minimum extent values averaged over the last 8 years exceed by about 10% the extent of glaciers reported by US Geological Survey (USGS) • Information on snow cover distribution and extent in the Southern Hemisphere can also be derived from data of a number of other satellite sensors. Since 2000 a set of cryosphere products has been generated by NASA using data from Moderate Resolution Imaging Spectroradiometer (MODIS) and Advanced Microwave Scanning Radiometer (AMSR-E) onboard Earth Observing System satellites Terra and Aqua. However the performance of both MODIS and AMSR-E snow algorithms over Southern Hemisphere is yet not optimal and needs improvement. Snow mapping technique To identify and map snow cover the automated snow mapping system uses satellite observations in the visible, shortwave-infrared and infrared spectral bands. Particular techniques applied to the data from polar orbiting and geostationary satellites are slightly different. The algorithm for geostationary satellites was developed to make maximum use of their frequent observations. It uses all images acquired during the day. The algorithm for polar-orbiting satellites utilizes only one image per day to generate the snow cover map. Snow can be identified only during daytime in clear sky conditions. To generate continuous (gap free) snow cover distribution on a daily basis we utilize a blending procedure. • MODIS snow cover algorithm in the Southern Hemisphere overestimates cloud cover and often interprets snow as clouds. This hampers its ability to timely reproduce changes in the snow cover distribution and hence to deliver adequate estimates of the total snow extent. Over South Africa the MODIS algorithm never “sees” snow. Yearly minimum snow extent in three areas comprising major glacier fields Snow cover duration in South America Snow detection with polar-orbiting satellite data Yearly snow cover duration is estimated from daily blended snow cover maps. Areas with snow duration over a week are only shown in the maps above. Glaciers in tropical Andes are identified only occasionally because of small area and frequent cloud cover over mountain tops. Therefore they do not show up as areas with permanent snow cover. • Snow map is an image-based product • Threshold-based decision-tree image classification • Uses observed spectral reflectance and brightness temperature in different spectral bands • Land surface temperature, snow cover climatology, and cloud cover texture tests are included to better identify pixels affected by clouds and cloud shadows • Applied to NOAA AVHRR data AVHRR snow map at 4 km resolution MODIS snow map at 5 km resolution Data files and images are available for evaluation and use at: ftp://ftp.orbit.nesdis.noaa.gov/pub/smcd/emb/snow/south_america/avhrr • Within the NASA EOS data processing system microwave observations from AMSR-E Aqua are used to estimate snow water equivalent (SWE). Microwave observations are practically weather independent, however their spatial resolution is coarse, they are not sensitive to shallow and melting snow, and tend to confuse frozen bare rocks with snow cover. These limitations are critical for snow monitoring in the Southern Hemisphere. The map on the left demonstrates a large overestimation of snow extent over Central Andes in South America by AMSR-E and its inability to properly identify glacier fields in the south of the continent. Australia and New Zealand South Africa Snow cover in Australia and New Zealand is derived from NOAA AVHRR GAC (4 km resolution) data. NOAA-17 AVHRR is currently used as the primary sensor for snow cover mapping. Snow is mapped only in the the South-East of Australia since it is never observed in other part of the continent. The primary output of the system is a daily blended snow map at 4 km resolution. Maps have been available since 2006. Meteosat SEVIRI observations are used to map snow in South Africa. Availability of frequent views from SEVIRI along with very good image navigation and registration make snow cover monitoring accurate, timely and efficient. Snow is mapped in the area below 240S. The primary output of the system is a daily blended snow map at 4 km resolution. Maps have been available since the middle of 2008. Snow mapping flow chart Snow detection with geostationary satellite data • Daily snow map incorporates all daytime observations made during the day • Daily image compositing: increases the number of cloud clear observations in the product, improves the area coverage • Threshold-based decision-tree image spectral classification. Uses observed spectral reflectance and brightness temperature in different spectral bands • Temporal stability filter examines temporal variation of scene response. Excessive variability is indicative of clouds. • Land surface temperature climatology test is included to better identify pixels affected by clouds • Applied to MSG SEVIRI and GOES Imager data AVHRR snow map at 4 km resolution AMSR-E SWE map Daily snow map (left) and blended snow map (right) What’s next ? MSG SEVIRI false color daily composited image Snow map Yearly maximum snow extent in New Zealand reached 80,000 km2 in 2006. In the last three years (2007-2009) the maximum extent of snow was noticeably smaller, but the duration of the snow season was longer than in 2006. • Our future plans include • Improvement of the snow cover monitoring system • - METOP AVHRR data will be incorporated in the system later this year . This will allow to improve the spatial resolution at least 2 times, to 2 km. • Reprocessing of historical NOAA AVHRR data • NOAA AVHRR observations are available since the beginning of 1980s. Consistent reprocessing of this data will allow for constructing a reliable high resolution snow cover climatology for the Southern Hemisphere and about 30-years long daily snow cover dataset for use in climate studies. • Reprocessing of historical AVHRR data presents a number of problems including accurate cross-calibration of satellite sensors that operated since the beginning of 1980s, tuning the algorithm to account for changes in the instrument spectral bands, adjusting the snow detection algorithm to account for satellite orbital drift. • Reprocessing may begin in the end of the current year. Snow cover duration in 2009 There is no stable winter-time snow cover in South Africa. From June to September snow may occasionally fall in the mountains, mostly in Lesotho. Australia and New Zealand daily snow extent 2006 2007 2008 2009 Blending snow maps Objective: Generate continuous (free of cloud gaps) snow map on a daily basis Approach: Cloudy pixels in the current day snow cover map are filled in with the results of the most recent cloud-clear observations from earlier snow maps. Snow cover duration in New Zealand. South Africa snow extent