Download
1 / 7
70 likes | 198 Views
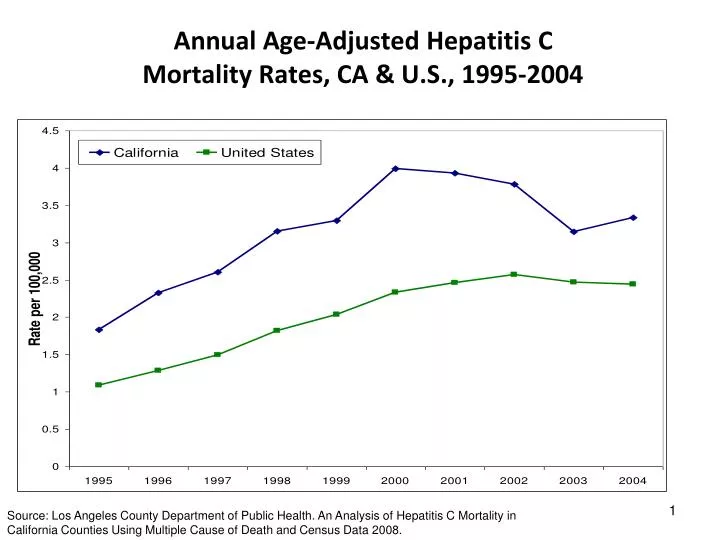
Annual Age-Adjusted Hepatitis C Mortality Rates, CA & U.S., 1995-2004. Source: Los Angeles County Department of Public Health. An Analysis of Hepatitis C Mortality in California Counties Using Multiple Cause of Death and Census Data 2008.

E N D
Annual Age-Adjusted Hepatitis C Mortality Rates, CA & U.S., 1995-2004 Source: Los Angeles County Department of Public Health. An Analysis of Hepatitis C Mortality in California Counties Using Multiple Cause of Death and Census Data 2008.
Chronic Hepatitis C – Rates of Newly Reported Cases, California, 1994-2011 Source: Chronic Hepatitis B and Hepatitis C Infections in California: Cases Newly Reported through 2011. California Department of Public Health (CDPH), Sexually Transmitted Diseases (STD) Control Branch, November 2013
Chronic Hepatitis C – Percent of Newly Reported Cases for Which Race/Ethnicity is Known, by Race/Ethnicity compared with the General Population, California, 2011 Newly Reported Cases of Chronic Hepatitis C General Population of California Source: Chronic Hepatitis B and Hepatitis C Infections in California: Cases Newly Reported through 2011. California Department of Public Health (CDPH), Sexually Transmitted Diseases (STD) Control Branch, November 2013
Chronic Hepatitis C – Cases and Rates of Newly Reported Cases (per 100,000) by Age and Gender, California, 2011 Source: Chronic Hepatitis B and Hepatitis C Infections in California: Cases Newly Reported through 2011. California Department of Public Health (CDPH), Sexually Transmitted Diseases (STD) Control Branch, November 2013
Chronic Hepatitis C – Rates of Newly Reported Cases in State Prisons by Age*, California, 2007-2011 + 46% Source: Chronic Hepatitis B and Hepatitis C Infections in California: Cases Newly Reported through 2011. California Department of Public Health, Sexually Transmitted Diseases (STD) Control Branch, November 2013.
Chronic Hepatitis C, Rates of Newly Reported Cases (per 100,000) by County, Excluding Cases in State Prisons, California, 2011 Source: Chronic Hepatitis B and Hepatitis C Infections in California: Cases Newly Reported through 2011. California Department of Public Health, Sexually Transmitted Diseases (STD) Control Branch, November 2013.
Hepatitis-Related Hospitalizations by Infection Status, California, 2002–2011 Source: Office of Statewide Health Planning and Development (OSPHD); Prepared by the CDPH Immunization Branch