Download
1 / 27
270 likes | 374 Views
Level-1 Sampling Overview. CVS-EEP Vegetation Monitoring Workshop June 17, 2008 Tom Wentworth – NC State University. CAROLINA VEGETATION SURVEY. Background – Level 1. Level 1 is designed specifically for restoration areas with planted material; only planted woody stems are inventoried.

E N D
Level-1 Sampling Overview CVS-EEP Vegetation Monitoring Workshop June 17, 2008 Tom Wentworth – NC State University CAROLINA VEGETATION SURVEY
Background – Level 1 • Level 1 is designed specifically for restoration areas with planted material; only planted woody stems are inventoried. • goals: to determine pattern of installation of woody stems with respect to species, spacing, and density, and to monitor their survival and growth
Information Gathered • Plot Data: • specific data about the plot (e.g., elevation) and metadata (data about the data, e.g., taxonomic standard used) • Planted Woody Stem Data: • information about all planted stems, including location, dimensions, vitality, and damage
Some General Guidelines • Complete as many fields as possible: • fields designated in Bold & Underlined must be completed • Use pencil (7 mm mechanical preferred). • It is generally preferable to cross out mistakes rather than to erase them. • Please take advantage of “NOTES” fields to record helpful information.
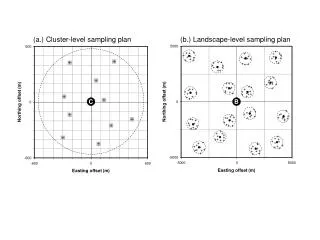
About the Inventory Plots • Location of stands - based on available vegetation, project goals, needs of landowners, representativeness, etc. • Size and shape of plots: • for level 1, always 100 m2 (1 are) and either 10 x 10 m (typical) or 5 x 20 m, as needed
About the Inventory Plots • Number of plots – please refer to CVS-EEP protocol for guidelines. • Other considerations: • project directors will select stands within which are placed a plot or plots • plots should be placed in such a way that avoids bias • plot placement should also avoid edge effects and achieve homogeneity of vegetation and environment
Plot Data -General Information: Plot ID • Plot identification is critical to success of the inventory effort: • Project Label: unique and assigned by EEP • Project name: official name (may not be unique) assigned by EEP • Team: each field team within a project has a unique number; use “1” if only one team exists • Plot: for each team, a unique numeric identifier for each plot, running sequentially from an initial plot number.
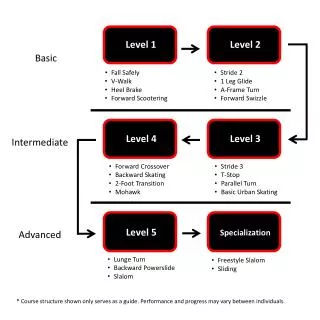
General Information:Level, Date(s), and Party • Level: available levels in CVS-EEP protocol are 1-5, but we are only considering level 1 for our current purposes. • Start Date: use dd/mmm/yyyy (e.g., 17/JUN/2008) format • add End Date if different from start date • Party and Role: • all contributors to collection of data, with roles played
General Information:Soil Drainage • Identifies the natural drainage conditions of the soil and refers to the frequency and duration of wet periods. • Categories are defined in terms of: • actual moisture content (in excess of field moisture capacity), and • the extent of period during which excess water is present in the plant-root zone • Please consult the protocol for details!
General Information: Water • Information requested: • percent of plot submerged (at the time of inventory) • mean water depth (where present)
Location • General: overall location (general place name) • State and County • USGS Quadrangle (if used) • Place Names: more specific location name(s) • Reach: section of river where study is located • Land Owner
GPS Location Data • Use of GPS for location data is required for level 1 sampling. • GPS Receiver Location - within plot, give X and Y coordinates, typically plot origin. • Specify Coordinate System (e.g., UTM) and Coord. Units (e.g., m). • Datum - critical information, because all geocoordinates are referenced to a datum, and many different datums are available: • we recommend NAD83/WGS84
GPS Location Data • UTM Zone (if using UTM system) • Lat or Northing (latitude in selected units or UTM-N [7-digit]) • Long or Easting (longitude in selected units or UTM-E [6-digit]) • Coordinate Accuracy - m radius, typically provided by GPS receiver • GPS File Name - if you saved a waypoint or other file
Site Characteristics • Elevation - best taken from topographic maps or GIS, or by using properly calibrated altimeter • Slope - plot inclination in degrees (always positive) • Aspect - azimuth (in degrees) of direction plot faces • Compass Type - are readings magnetic or true (corrected for local declination)?
Plot Placement • Project Director or Plot Leader will make this determination.
Taxonomic Standard • Plant nomenclature is notoriously labile! • It is important to cite the authority (reference) used for the names you applied to plants, because this identifies the concepts behind the names. • Our current preference is Alan Weakley’s regional flora (currently 2006 version), but you may choose other standards, or possibly multiple standards!
Plot Diagram • This important diagram captures: • plot shape and dimensions (plot size is default of 1 are [=100 m2]) • location of plot origin and marking posts (including X and Y coordinates of all posts relative to origin) • GPS location point • location and bearing of photo(s) • bearing of plot x-axis • locations of landmarks, such as streams, banks, fences, witness trees, etc.
Notes • These notes capture additional information about: • Layout (especially unusual features) • Plot Location - relocation information can be summarized here • Plot Rationale - why this particular location was chosen for the plot • Other Notes - typically, this field will capture information about disturbance type and severity
Planted Woody Stem Data Form: Header • Field at top of second data form (Planted Woody Stem Data) • repeats information from Plot Data form • essential for reuniting data forms if they become separated, so please fill this out as you begin recording data! • add page numbering as needed
Planted versus Natural Stems • The CVS-EEP Protocol for Recording Vegetation requires that a distinction is made between planted and natural woody stems. Which is which? • if there is positive confirmation (e.g., planting plan) or strong evidence (e.g., burlap shreds) that a stem was planted, then consider it planted…otherwise, consider it natural (not recorded in Level 1)!
Planted Stem Data Entry:VBD versus VMD • For newly-constructed projects, planted woody stems are initially inventoried through collection of Vegetation Baseline Data (VBD): • In years following initial plot establishment, the protocol specifies collection of Vegetation Monitoring Data (VMD): • preprinted forms are provided to contractors with the most recent year’s data for planted woody stems in the plot (including a map of stems) • contractors update the VMD data form with current dimensions and status of planted woody stems
VBD Planted Stem Data Entry:Species & Source • Species Name - use Latin binomials, following your taxonomic standard • Source - was planted material Transplanted, Live staked, Balled and burlapped, Potted, Tubling, Bare Rooted, or Mechanically planted? http://www.life.uiuc.edu/edtech/entomology_slides/images/31067-linnaeus.jpg
VBD Planted Stem Data Entry:Coordinates • X and Y Coordinates relative to plot origin (same system used to specify location of posts): • In meters, to nearest decimeter (i.e., to 0.1 m precision) • Values are binned (truncated) such that: • 0.0 - 0.099 m is 0.0m • 0.1 - 0.199 m is 0.1m • 0.2 - 0.299 m is 0.2m • and so on...
VBD Planted Stem Data Entry:Stem Dimensions • ddh - diameter (mm) at one decimeter height - of largest of multiple stems, but smallest dimension if elliptical, also binned • Height - height (cm) to tallest perennating organ (typically a terminal bud), also binned • DBH - diameter in cm at breast height (1.37 m) for taller plants, also binned
VBD Planted Stem Data Entry:Vigor and Damage • Vigor - 4 (excellent) to 0 (dead) categories, plus Missing (for resurveys) • Damage - records observed injury to planted stems (categories on data form)
Wrap-Up • Work efficiently! • Work safely! • the “bear” facts about safety • questions?