Download
1 / 18
180 likes | 388 Views
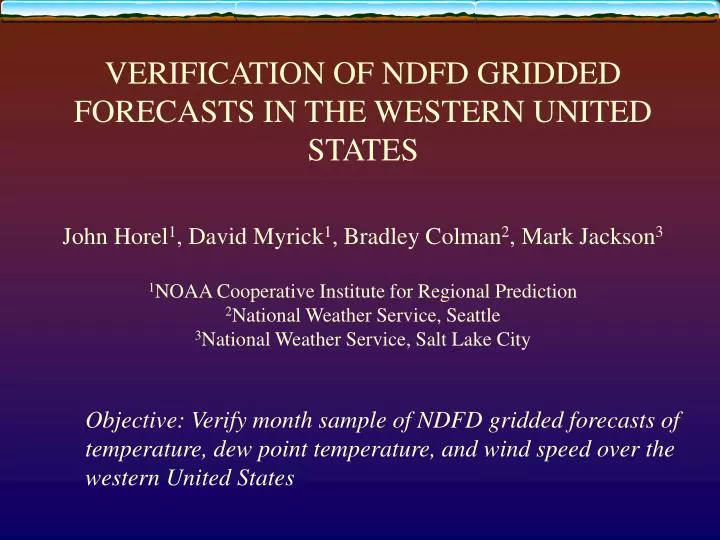
VERIFICATION OF NDFD GRIDDED FORECASTS IN THE WESTERN UNITED STATES John Horel 1 , David Myrick 1 , Bradley Colman 2 , Mark Jackson 3 1 NOAA Cooperative Institute for Regional Prediction 2 National Weather Service, Seattle 3 National Weather Service, Salt Lake City.

E N D
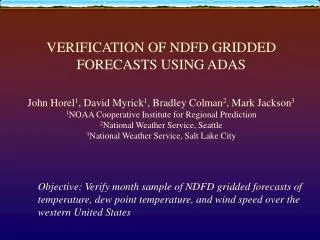
VERIFICATION OF NDFD GRIDDED FORECASTS IN THE WESTERN UNITED STATESJohn Horel1, David Myrick1, Bradley Colman2, Mark Jackson31NOAA Cooperative Institute for Regional Prediction2National Weather Service, Seattle3National Weather Service, Salt Lake City Objective: Verify month sample of NDFD gridded forecasts of temperature, dew point temperature, and wind speed over the western United States
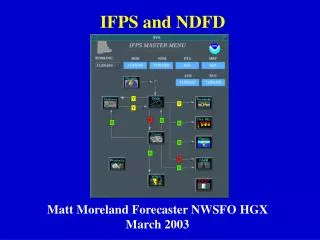
IFPS and NDFD • NWS has undergone major change in procedures to generate and distribute forecasts • Interactive Forecast Preparation System (IFPS; Ruth 2002) used to create experimental high-resolution gridded forecasts of many weather elements • Forecast grids at resolutions of 1.25, 2.5, or 5 km produced at each NWS Warning and Forecast Office (WFO) and cover their respective County Warning Area (CWA) • CWA grids combined into National Digital Forecast Database (NDFD; Glahn and Ruth 2003) at 5-km resolution • NDFD elements include: temperature, dewpoint, wind speed, sky cover, maximum and minimum temperature, probability of precipitation, and weather • Available up to hourly temporal intervals with lead times up to 7 days • Products can be: • viewed graphically • downloaded by customers and partners • linked to formatting software to produce traditional NWS text products
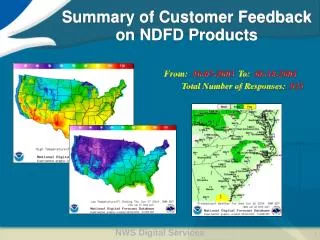
Validation of NDFD Forecast Grids Developing effective gridded verification scheme is critical to identifying the capabilities and deficiencies of the IFPS forecast process (SOO White Paper 2003) • National efforts led by MDL to verify NDFD forecasts underway • Forecasts available from NDFD for a particular grid box are intended to be representative of the conditions throughout that area (a 5 x 5 km2 region) • Many complementary validation strategies: • Interpolate gridded forecasts to observing sites • Compare gridded forecasts to gridded analysis based upon observations • Objective of this preliminary study: • Compare NDFD forecasts to analyses created at the Cooperative Institute for Regional Prediction (CIRP) at the University of Utah, using the Advanced Regional Prediction System Data Assimilation System (ADAS) • Period examined 12 November – 24 December 2003
ADAS: ARPS Data Assimilation System • ADAS is run in near-real time to create analyses of temperature, relative humidity, and wind over the western U. S. (Lazarus et al. 2002 WAF) • Analyses on NWS GFE grid at 2.5, 5, and 10 km spacing • Typically > 2000 surface temperature and wind observations available via MesoWest for analysis • The 20km Rapid Update Cycle (RUC; Benjamin et al. 2002) is used for the background field • Background and terrain fields help to build spatial & temporal consistency in the surface fields • Current ADAS analyses are a compromise solution; suffer from many fundamental problems due to nature of optimum interpolation approach
MesoWest: Cooperative sharing of current weather information around the nation Real-time and retrospective access to weather information through state-of-the-art database http://www.met.utah. edu/mesowest Horel et al. (2002) Bull. Amer. Meteor. Soc. MesoWest
Arctic Outbreak: 21-25 November 2003 NDFD 48 h forecast ADAS Analysis
ADAS Analysis 48 H NDFD Forecast RMS difference RUC2-OBS: 2.7C (0z) 4.0C (12z) RMS difference ADAS-OBS: 1.7C (0z) 2.4C (12z) Average 00Z Temperature: 18 Nov.- 23 Dec. 2003
Average RMS Differences between NDFD Forecasts and ADAS grids over the Western United States NDFD Forecasts Issued 00z. Period: 12 Nov.-24 Dec. 2003 Valid at 0z
Arctic Outbreak: 21-25 November 2003 NDFD and ADAS sample means removed NDFD 48 h forecast ADAS Analysis
Temperature spatial anomaly pattern correlation as a function of NDFD forecast length during 12 Nov.-24 Dec. 2003Anomaly relative to sample average for NDFD and ADAS Comparison of daily temperature anomaly maps Nov. Dec.
Temperature spatial anomaly pattern correlation as a function of NDFD forecast length. Average 12 Nov.-24 Dec. 2003Anomaly relative to sample average for NDFD and ADAS
Summary • Assimilation of surface data is critical for generating and verifying gridded forecasts of surface parameters • MDL is using RUC for national NDFD validation and is exploring use of ADAS in the West • Differences between ADAS analysis and NDFD forecast grids result from combination of analysis and forecast errors • Difference between ADAS temperature analysis on 5 km grid and station observations is order 1.5-2.5C • Difference between NDFD temperature forecast and ADAS temperature analysis is order 3-5C. May reflect upper bound of forecast error since ADAS analysis contains biases • Anomaly pattern correlations between NDFD and ADAS temperature grids over the western United States suggest forecasts are most skillful out to 48 h • Major issue for NDFD validation: true state of atmosphere is unknown • Specific issues for NDFD Validation in Complex Terrain • Scales of physical processes • Analysis methodology • Validation techniques
Issues for NDFD Validation in Complex Terrain • Analysis Methodology • Analysis of record will require continuous assimilation of surface observations, as well as other data resources (radar, satellite, etc.) • Requires considerable effort to quality control observations (surface stations siting issues, radar terrain clutter problems, etc.) • Quality control of precipitation data is particularly difficult • NWP model used to drive assimilation must resolve terrain without smoothing at highest possible resolution (2.5 km) • NCEP proposing to provide analysis of record for such applications
Issues for NDFD Validation in Complex Terrain • Validation technique: • Upscaling of WFO grids to NDFD grid introduces sampling errors in complex terrain • Which fields are verified? • Max/min T vs. hourly temperature? • Max/min spikes • fitting of sinusoidal curve to Max/Min T to generate hourly T grids • instantaneous/time average temperature obs vs. max/min • Objectively identify regions where forecaster skill limited by sparse data
Related Presentations • Monday Poster Session. David Myrick. A Modification to the Bratseth Method of Successive Corrections for Complex Terrain • Mike Splitt. Geospatial Uncertainty Analysis and Gridded Forecast Verification. Room 3A 8:30 Tuesday
Average RMS Differences between NDFD Forecasts and ADAS grids over the Western United States NDFD Forecasts Issued 00z. Period: 12 Nov.-20Dec. 2003 Valid at 0z and 12z
48 h Forecast RMS Difference(NDFD –ADAS)00z 18 Nov.-23 Dec. 2003