Download
1 / 27
270 likes | 403 Views
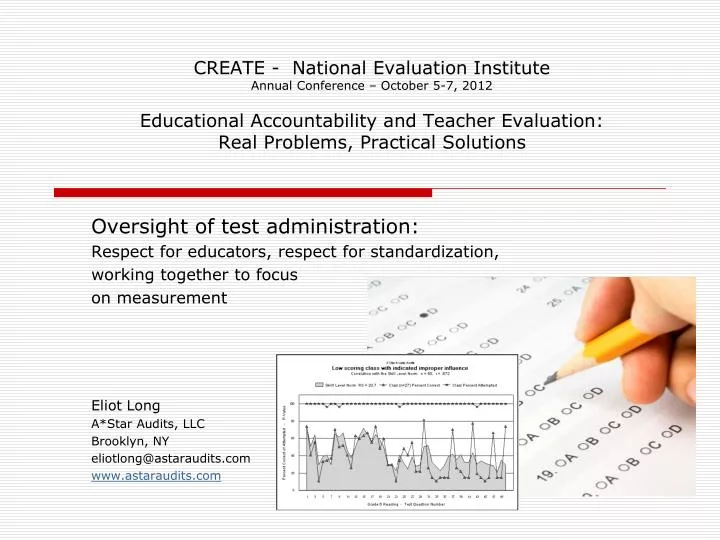
CREATE - National Evaluation Institute Annual Conference – October 5-7, 2012 Educational Accountability and Teacher Evaluation: Real Problems, Practical Solutions. Oversight of test administration: Respect for educators, respect for standardization, working together to focus on measurement

E N D
CREATE - National Evaluation InstituteAnnual Conference – October 5-7, 2012Educational Accountability and Teacher Evaluation:Real Problems, Practical Solutions Oversight of test administration: Respect for educators, respect for standardization, working together to focus on measurement Eliot Long A*Star Audits, LLC Brooklyn, NY eliotlong@astaraudits.com www.astaraudits.com
Talking about oversight 1. Why? Why is oversight necessary? What are the problems and how significant are they? Is this all worth the trouble? 2. How? How will we measure compliance? How will we collect/analyze data? What range of error – what is the misjudgment potential? 3. What? What will we do with the results of the oversight? Costly, time consuming investigations? Educator sanctions? Lower test scores???? 4. Focus What is our focus in choosing our methods and practices? MEASUREMENT requires RELIABILITY requires STANDARDIZATION
Need for Oversight:What are the problems we are seeking to fix? Problems in test administration: Confusion – misdirection Misunderstanding, lack of preparation Special directions for some, but not all, students Inappropriate strategies for test-taking Guessing strategies (Choose a middle size answer …) Hurry, skim look for easy questions first Improper assistance Hints (Remember when to invert and multiply …) Rereading, clarifying test questions Brief instruction on test content Cheating … You wouldn’t want to be caught doing it. All forms of misadministration undermine test score reliability and usefulness See, for example, 19 ways to raise student scores: Amrein-Beardsley, A., Berliner, D.C. & Rideau, S. (2010) “Cheating in the first, second, and third degree: Educators’ responses to high-stakes testing”. Educational Policy Analysis Archives, 18(14). Recovered from http://epaa.asu.edu/ojs/article/view/714
Outcomes of Improper Influence:Undermines the usefulness of test scores for program evaluation and accountability See: 2009 CREATE Conference “Masking Variations in Achievement Gain” By Eliot Long Encouraged guessing is found to: 1. Reduce the range of measure with respect to the true range of test-taker achievement. Reduce general pop. variance by 30% 2. Create widely varying classroom to classroom test score reliability. Reduce general pop. reliability by ? 3. Create a test score modulator – with changes in achievement and proctor influence moving in the opposite, offsetting, direction. Mask true achievement gains by 35% for students at Basic Performance
Evaluating student response patternsfor evidence of improper influence Student response patterns: Taken as a group, students in a classroom succeed or fail with the individual test questions in a pattern that: 1. Reflects the difficulty of the test questions and 2. Follows the same fluctuations as the patterns for other classrooms at the same achievement level. A band of normative deviations may be established around the norm for any one achievement level.
Evaluating a classroom to its achievement level (peer group) norm Skill level norm: All classrooms at the same achievement level set a peer group or ‘skill level’ norm. P-value correlation: One method of comparison is a correlation of the class and skill level p-values. Here, for a 50 item test, n = 50; r = .95 Percent attempted: The line with stars indicates the percent of students who answer each item. Skill Level Norm
Consistency within and across Assessment Settings Consistency of Group Test Administrations When all group profiles are correlated with their appropriate skill level norms, the distribution of correlation coefficients indicates the level of test administration consistency within the assessment setting. Consistency of Educational vs. Industrial Assessment A comparison of classroom groups with job applicant groups (tested by employers) indicates lower consistency in classroom test administrations. Schools median r = .900 Classrooms median r = .907 Employers median r = .958
Proctor Influence to Guess Two Low Performing Classrooms Two Different Forms of Encouragement to Guess Encouragement to Encouragement to Guess at Random Guess by choosing ‘C’
Guessing Effects within the Classroom Low performance due to guessing? Teacher encouragement to guess is challenged by the variation in student achievement and need to guess, potentially resulting in under assessment. The class below has a poor correlation with the norm (.74). Guessing by some students and n = 8 teacher actions to encourage it RS = 29.4 contradict norm patterns. r Corr. = .80 Full class: n = 18; RS = 22.3; r Corr. = .74 n = 10 RS = 16.6 r Corr. = .44 25% Correct
Proctor Effects on Summer School Gain Indications from Summer School - Two major patterns for test work behavior inferred from results. 1. Proctor directions: Answer the questions in order, to take time, work carefully, and reserved guessing until the end of the session. . 2. Proctor direction to either: a) First skim the test to look for the easy questions, then guess, or b) Hurry from the beginning, don’t waste time on difficult questions, guess and move on.
Improper Proctor Influence Proctor influence ranges from positive to moderately negative to a serious undermining of the assessment. Significant improper influence leads to measurable deviations in classroom response patterns. Response pattern probability: P < 0.01 Response pattern probability: P < 0.001 Correlation with the norm: r = .713 Correlation with the norm: .579
Subject Group Analysis See: A*Star Method Available at www.astaraudits.com Identify those test-takers most likely to have been the subject of improper proctor influence - Determine the expected frequency at each answer alternative for each total test score based on observed frequencies in the state population - Identify item responses consistent with the group pattern irregularity - Identify the joint likelihood of these item responses at each score level - Apply the likelihood estimate to each score level in the group - Sum the observed and expected frequencies for the group - Compare the observed to the expected frequency via the binomial probability distribution. Determine the # of students and the # test answers involved and the likelihood of this combination occurring in classrooms of the same size and at the same achievement level.
Subject Group AnalysisIdentify those most likely subject to improper influence Most often, improper teacher influence is unplanned and disorganized. Yet, where the influence is persistent, subsets of students will be identified with matching, unlikely response patterns. Subject Group: n = 8 of 17Subject Group: n = 12 of 19 Response pattern probability P = 3.43e-9 Response pattern probability: P = 6.68e-15 Correlation with the norm: r = .498 Correlation with the norm: r = .342
School Administrator Involvement School administrator involvement is indicated when a highly irregular (highly improbable) response pattern is found that crosses over classrooms. Full school (n=69) response pattern Subset group (n=30) includes students reveals a substantial irregularity over from several classrooms, indicating an the early test items. influence from outside the classroom.
Confirmation of Improper InfluenceHow do we know that irregular response patternsindicate improper test administration? Confirmation for statistical analysis Testing program: “Ability-To-Benefit” testing: Basic reading and math skills Program of the Office of Federal Student Aid Analyses by: Most major test publishers Reviewed by: U. S. Dept. of Education, Office of Inspector General OIG Report: Final Management Information Report, Jan. 25, 2010 Available at: www2.ed.gov/about/offices/list/oig/ alternativeproducts/x11j0002.pdf Summary: OIG data analytics project investigated 106 test administrators indicated by the A*Star method; 83 were identified by the OIG while an unspecified number of others were not investigated due to their small number of test administrations after applying the statute of limitations.
Defining “Significant” Misadministration What constitutes “significant” cases of misadministration (cheating)?” Number of test items effected Improper influence on any test item is wrong, but influence on only a few items is more likely an effort to facilitate the test administration rather than to materially raise test scores. Number of students involved My sense of it is that a large number of items for a few students is a greater problem than a few items for a large number of students – the latter may be a perceived problem with the items while the former an effort to raise the scores of lower performing students. Improbability of response pattern Any probability less than 1 in 10,000 is significant, but common, wrong answers create unusually low probabilities that may overshadow more important problems. A “six sigma” approach is conservative. Definition used here: Minimum 10% of test items Minimum #SGA students times #SGA items = 5% of all responses Probability less than 1 in 100,000 (less than 10 in one million)
Audit Summary of Large Urban District - 2001 2001 Urban District Elementary Schools Grade 5 Math Chart of schools by the A*Star analysis of each school’s Grade 5 Math test response pattern – plot by the volume of test responses potentially subject to improper influence and by the improbability of the pattern occurring in a normative test administration. Response PatternPct. of Schools Consistent with norms 85% Modest irregularity 12% Severe irregularity 3%
Ability-To-Benefit Testing - 2002-2005Reviewed by Office of Inspector General 2002-2005 Nationally distributed Occupational Training Schools Basic Math Skills Chart of schools by the A*Star analysis of each school’s student applicants’ test response pattern. Plot by the volume of test responses potentially subject to improper influence and by the improbability of the pattern occurring in a normative test administration. Response PatternPct. of Schools Consistent with norms 67% Modest irregularity 19% Severe irregularity 14%
East Coast State - 2008 East Coast Statewide Review Elementary Schools Grade 4 Math Chart of schools by the A*Star analysis of each school’s Grade 4 Math test response pattern – plot by the volume of test responses potentially subject to improper influence and by the improbability of the pattern occurring in a normative test administration. Response PatternPct. of Schools Consistent with norms 37% Modest irregularity 41% Severe irregularity 22%
Addressing the problem There are significant deviations from standardized test administration that materially undermine the usefulness of test scores. What do we do about it? - Comprehensive instructions for school administrators and teachers - Regular review of test results for misadministration - Communication with educators when irregularities arise - Reserve sanctions for persistent cases of misadministration.
Case in point: Whole test manipulationSame Teacher – Two Successive Years The first year - begins normally and becomes increasingly irregular. The second year - begins irregular and continues over the entire test suggesting a preplanned intent to control the testing outcome. Second Year - Grade 5 Reading Correlation with the norm: r = .487 First Year Grade 5 Reading r = .750 First Year Grade 5 Math r = .527 Not caught by erasure analysis due to low pct. wrong to right (40%).
Self Correction - following notice Oversight improves proctoring Following the second year reading test, the teacher was notified that her testing practices were under investigation Three weeks later, her administration of the math test was remarkably improved. Grade 5 Math – Second Year Note:Pattern correlation with the norm: r = .947 The teacher was not given any instruction on how to change her test administration practices. She was only told that irregularities had been found in her students’ test answers. The next test administration resulted in an essentially perfect response pattern.
Oversight Program StepsStep 1: Directions for Test Administration Provide comprehensive directions for managing the classroom and conducting the test administration Address all issues that arise in test administration For example: 1. How students should respond when they do not know how to respond. i.e. Guess? Use ‘test wise’ guessing strategies? Leave blank? 2. How to deal with apparent misalignment of the test with the curriculum. i.e. When there is test material not included in classroom instruction. 3. What should the teacher do when she/he notices a student mark a wrong answer when she/he knows the student knows the correct answer? Test directions should be rewritten following meetings with school administrators and teachers to review response pattern research and address all issues challenging standardized test administration.
Oversight Program StepsStep 2: Conduct Regular Review of Test Response Patterns Conduct annual review of test response patterns, for each test, by classroom and by school. The review should: Identify: 1. Problems in the test construction or in the directions for test administration. 2. Locations with irregular results and likely misadministration. Provide: 3. Trend analysis for each classroom and school Have past irregularities been cured? Is there a sudden change in the qualify of test administration? 4. Resource to evaluate complaints or allegations of misconduct. 5. Resource to evaluate test score input to teacher evaluation.
Oversight Program StepsStep 3: Report review results to administrators & educators Report results and recommendations Prepare a written report for each administrator and teacher/test administrator. 1. Measure of consistency with norms for the same achievement level. 2. To the extent possible, indicate areas of test administration procedures for future improvement.
Oversight Program StepsStep 4:Remedial steps for instances of particularly severe or repeated irregularities Remedial Steps: 1. Meet with assessment liaison or trainer to review areas of needed improvement. 2. Assignment to professional development test administration program 3. Assign monitor for next assessment session. 4. Provide substitute test administrator for next test session 5. Conduct investigation leading to potential sanctions.
Summary of Oversight of Test Administration A focus on measurement through standardized assessment Oversight of Test Administration 1. Provide a comprehensive set of written directions for school administrators and teachers. 2. Conduct annual reviews of test response patterns. 3. Provide timely test administration reports to all involved. 4. Provide a series of steps to inform, train, and motivate test administrators to improve practices where necessary. 5. Provide sanctions for test administrators who fail to improve practices over multiple test administrations. 6. Use experience to improve directions, methods of analysis and interpretation, and methods of communication and training.