Download
1 / 21
210 likes | 327 Views
“What Drives Student Satisfaction ?”. NCAIR/SCAIR Conference Charleston, South Carolina March 3, 2013 Ross A. Griffith and I xavier A. Higgins Wake Forest University http ://www.wfu.edu/ir /. Founded in 1834 Schools: Arts and Sciences, Business, Divinity, Graduate, Law, and Medicine

E N D
“What Drives Student Satisfaction?” NCAIR/SCAIR Conference Charleston, South Carolina March 3, 2013 Ross A. Griffith and IxavierA. Higgins Wake Forest University http://www.wfu.edu/ir/
Founded in 1834 • Schools: • Arts and Sciences, Business, Divinity, Graduate, Law, and Medicine • Total FTE enrollment – 7,130 • Undergraduate – 4,623 • 6 year graduation rate –87% • Student/faculty ratio – 11/1 • SAT/ACT optional in 2009
Overview • Seniors majoring in Mathematical Business collaborate with Office of Institutional Research for project in their capstone course • Students in 2012 for project presented were Shannon McGorry, Will Correa and Ben Blais • Regression Study on satisfaction items conducted on 2011 College Senior Survey (CSS) • Significant Difference Study conducted on Males vs. Females, Greeks vs. Non-Greeks and Business vs. Non-Business majors on 2011 CSS
Background of College Senior Survey (CSS) • Office of Institutional Research administers College Senior Survey (CSS) to graduating seniors every other odd year in the Spring • Survey gauges graduating seniors’ opinions and satisfaction level with various university aspects • A total of 239 graduating seniors in 2011 completed over 200 questions representing 25% of graduating class
Regression Study • The most important dependent variable, “If you could make your college choice over, would you still choose to enroll at your current college?” was correlated with 21 satisfaction questions as independent variables. • Students used unit record data in SPSS to conduct the study • Provide recommendations for improvements based on senior survey analysis
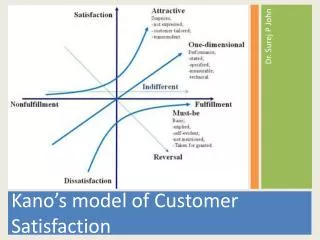
Original Report • Jill Wetzel’s “What Drives Student Satisfaction? An Analysis of Senior Survey Data,” 1994. • Analyzed HEDS’ Senior Survey results from national private colleges and universities • Featured quadrant graph to group independent variables impacting student satisfaction • Attempts to answer same question from this report applied to Wake Forest
2009 Report • Different students in 2010 produced replica of Wetzel’s report for 2009 senior survey data • Used two dependent variables: reenrollment and overall satisfaction with college experience • Presented results, analysis, and recommendations based on 2009 survey
Variable Selection for 2011 Report • Priority was for variables with largest impact on Wake Forest students’ satisfaction • Used 2009 Report variables to compare to 2011 Report • Chose additional demographic variables that would provide university important insight • Finally, examine Top Priority variables from 2009 Report to determine improvements made
Methodology for Regression • Reenrollment = β0 + β1*VAR1 +…+ β21*VAR21 + ε • 21 total independent variables included in the model • Variables with highest correlation with respect to the dependent variable selected—higher the correlation, higher the importance • Very little difference for correlations in independent variables and two dependent variables (conducted in 2009 report)
Methodology for Significant Differences • H0: μGroup1 = μGroup2 H1: μGroup1 ≠μGroup2 • Males vs. Females, Greek vs. non-Greek, Business Majors vs. Non-Business Majors • Removed missing values & “N/A responses” • The mean values for several questions were multiplied by 5/4 • Conducted a test of mean difference and set a significance level of .05
Results – Satisfaction by Motivational Importance • Top Priority- those variables with low satisfaction yet high impact on decision to reenroll. • On Target- those variables with both high satisfaction among students and high importance on decision to reenroll. • Low Priority- those variables with low satisfaction and low impact on decision to reenroll. • Sleepers- those variables with high satisfaction and low impact on decision to reenroll.
Demographic Differences • Students also studied three different “demographic groups” • Male vs. Female • Business vs. Non-Business • Greek vs. Non-Greek • Tested differences between these groups for reenrollment probability and satisfaction with social life
Significant Differences • Greeks were more likely to reenroll than non-Greeks (3.42 vs. 3.2) • Females slightly higher than males to reenroll (3.37 vs. 3.19) • Business students were no more likely to reenroll than non-business students.
Social Life Satisfaction • Females have higher satisfaction than males (3.22 vs. 3.00) • Greeks have higher satisfaction than non-Greeks (3.32 vs. 2.97) • Difference between Greek female vs. non-Greek female is greater than the difference between Greek male vs. non-Greek male • This finding suggests that female’s social life is more greatly affected by their Greek affiliation
Males vs. Females • Males Significantly Higher: • Challenged professor’s ideas • Self-rating: • Academic ability • Creativity • Leadership • Mathematical abilities • Career Concerns • High Income • Leadership potential • Own business • Females Significantly Higher: • Involvement on campus: • Performing community service • Joining a fraternity/sorority • Voting in student elections • Less interaction with faculty members • Satisfaction with Overall college experience • Overall GPA
Greeks vs. Non-Greeks • Greeks Significantly Higher: • White • Drink alcohol • Participate in clubs • Perform volunteer work • Vote in student elections • Raise money for a cause • Study abroad • Career concerns: • High income • Social recognition • Non-Greeks Significantly Higher: • Satisfaction with: • Library facilities • Tutoring • Career counseling • Housing • Job placement • Overall quality of instruction
Comparison to 2009 Survey • Improvements: • Racial Diversity • Availability of Social Activities on Campus • Satisfaction with amount of contact with faculty • Satisfaction with computing facilities • Declines: • Satisfaction with student housing • Satisfaction with financial aid package
Recommendations • Focus on Top Priority variables • Racial diversity • Career planning • Housing • Academic advising • Focus on Social Life for Non-Greeks particularly
“What Drives Student Satisfaction?” NCAIR/SCAIR Conference Charleston, South Carolina March 3, 2013 Ross A. Griffith and IxavierA. Higgins Wake Forest University http://www.wfu.edu/ir/