Download
1 / 10
100 likes | 244 Views
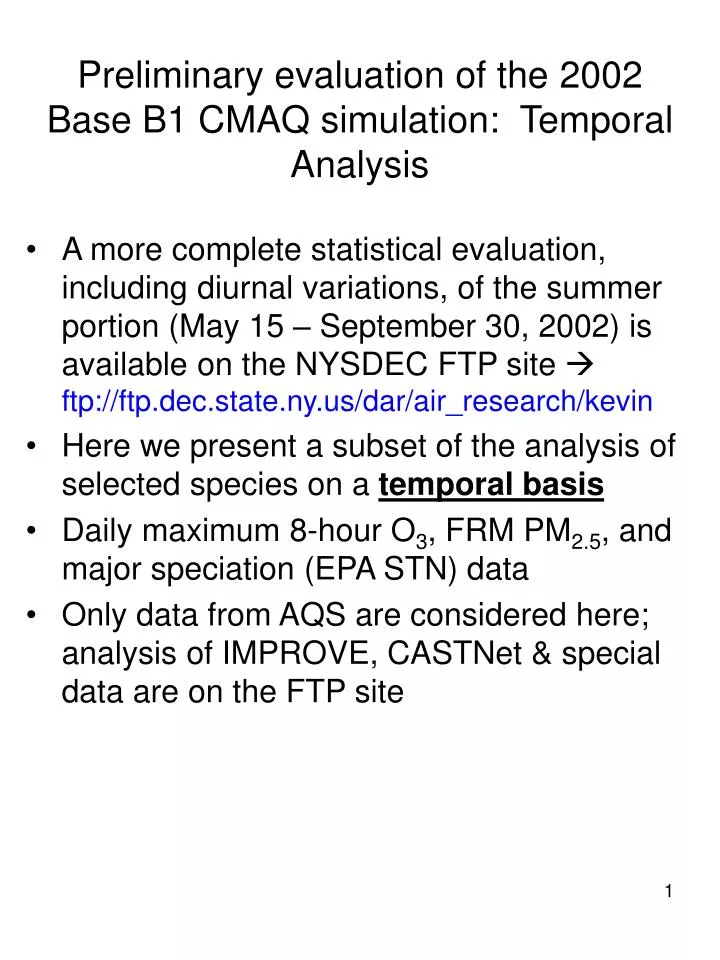
Preliminary evaluation of the 2002 Base B1 CMAQ simulation: Temporal Analysis. A more complete statistical evaluation, including diurnal variations, of the summer portion (May 15 – September 30, 2002) is available on the NYSDEC FTP site ftp://ftp.dec.state.ny.us/dar/air_research/kevin

E N D
Preliminary evaluation of the 2002 Base B1 CMAQ simulation: Temporal Analysis • A more complete statistical evaluation, including diurnal variations, of the summer portion (May 15 – September 30, 2002) is available on the NYSDEC FTP site ftp://ftp.dec.state.ny.us/dar/air_research/kevin • Here we present a subset of the analysis of selected species on a temporal basis • Daily maximum 8-hour O3, FRM PM2.5, and major speciation (EPA STN) data • Only data from AQS are considered here; analysis of IMPROVE, CASTNet & special data are on the FTP site
Daily maximum 8-hour average O3with a minimum observed threshold of 40 ppb at 208 SLAMS/NAMS sites across the OTR and Virginia. Top panel shows observed and predicted composite averages, bottom panel shows the root mean square error and mean bias (P-O). At least 10 monitors per day were required for displaying the statistics on a given day. Data from the July 6-9 period are excluded since they may be affected by the Canadian forest fires.
Daily maximum 8-hour average O3 witha minimum observed threshold of 60 ppb at 208 SLAMS/NAMS sites across the OTR and Virginia. Top panel shows observed and predicted composite averages, bottom panel shows the root mean square error and mean bias (P-O). At least 10 monitors per day were required for displaying the statistics on a given day. Data from the July 6-9 period are excluded since they may be affected by the Canadian forest fires.
Daily average FRM PM2.5 mass at 257 SLAMS/NAMS sites across the OTR and Virginia. Top panel shows observed and predicted composite averages, bottom panel shows the root mean square error and mean bias (P-O). At least 10 monitors per day were required for displaying the statistics on a given day, and only those days when the observed and predicted mass agreed to within a factor of 25 are included. Data from the July 6-9 period are excluded since they may be affected by the Canadian forest fires.
Daily average SO4 mass at 49 EPA STN sites across the OTR and Virginia. Top panel shows observed and predicted composite averages, bottom panel shows the root mean square error and mean bias (P-O). At least 10 monitors per day were required for displaying the statistics on a given day, and only those days when the observed and predicted mass agreed to within a factor of 25 are included. Data from the July 6-9 period are excluded since they may be affected by the Canadian forest fires.
Daily average NO3 mass at 49 EPA STN sites across the OTR and Virginia. Top panel shows observed and predicted composite averages, bottom panel shows the root mean square error and mean bias (P-O). At least 10 monitors per day were required for displaying the statistics on a given day, and only those days when the observed and predicted mass agreed to within a factor of 25 are included. Data from the July 6-9 period are excluded since they may be affected by the Canadian forest fires.
Daily average NH4 mass at 49 EPA STN sites across the OTR and Virginia. Top panel shows observed and predicted composite averages, bottom panel shows the root mean square error and mean bias (P-O). At least 10 monitors per day were required for displaying the statistics on a given day, and only those days when the observed and predicted mass agreed to within a factor of 25 are included. Data from the July 6-9 period are excluded since they may be affected by the Canadian forest fires.
Daily average EC mass at 49 EPA STN sites across the OTR and Virginia. Top panel shows observed and predicted composite averages, bottom panel shows the root mean square error and mean bias (P-O). At least 10 monitors per day were required for displaying the statistics on a given day, and only those days when the observed and predicted mass agreed to within a factor of 25 are included. Data from the July 6-9 period are excluded since they may be affected by the Canadian forest fires.
Daily average OM (=1.8×blank-corrected OC) mass at 49 EPA STN sites across the OTR and Virginia. Top panel shows observed and predicted composite averages, bottom panel shows the root mean square error and mean bias (P-O). At least 10 monitors per day were required for displaying the statistics on a given day, and only those days when the observed and predicted mass agreed to within a factor of 25 are included. Data from the July 6-9 period are excluded since they may be affected by the Canadian forest fires.
Daily average soil/crustal mass at 49 EPA STN sites across the OTR and Virginia. Top panel shows observed and predicted composite averages, bottom panel shows the root mean square error and mean bias (P-O). At least 10 monitors per day were required for displaying the statistics on a given day, and only those days when the observed and predicted mass agreed to within a factor of 25 are included. Data from the July 6-9 period are excluded since they may be affected by the Canadian forest fires. The data from July 4 are also excluded (substantial effects from fireworks).