Download
1 / 38
470 likes | 705 Views
Data Formats & QC Analysis for NGS. Rosana O. Babu. Sequence Formats. All Sequence formats are ASCII text containing sequence ID, Quality Scores, Annotation details, comments, and other descriptions about sequence

E N D
Data Formats & QC Analysis for NGS Rosana O. Babu
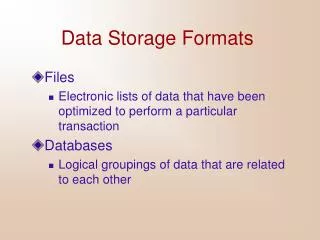
Sequence Formats • All Sequence formats are ASCII text containing sequence ID, Quality Scores, Annotation details, comments, and other descriptions about sequence • Formats are designed to hold sequence data and other information about sequence
Why so many formats? • Supply required information for each step of analysis • Efficient Data management- moving data across file system takes time • Each Data formats vary in the information they contain • Five types of sequence file formats • Raw Sequence files • Co-ordinate files • Parameter files • Annotation files • Metadata files
Read output formats • 454 • Solexa/Illumina • SOLiD
454 output formats .sff .fna .qual
Illumina output formats .seq.txt .prb.txt Illumina FASTQ (ASCII – 64 is Illumina score) Qseq (ASCII – 64 is Phred score) Illumina single line format SCARF
SOLiD output format(s) CSFASTA
If reads should be deposited in a public repository: SRA (Short Read Archive) at NCBI ENA at EMBL-EBI
Common (“standard”) format for read alignments: Alignment/Assembly Format SAM BAM(= binary SAM)
Formats for Genome/Gene annotation BED format (genome-browser tracks) GFF format (gene/genome features) BioXSD (XML) (any annotation; under development)
Deposit genome/metagenome in a public repository: INSDC databases: GenBank, EMBL, DDBJ International Nucleotide Sequence Database Collaboration Deposit genome/metagenome metadata: MIGS/MIMSstandard by GSC Genomic Standards Consortium
MIGS: Minimum Information about a Genome SequenceMIMS: Minimum Information about a Metagenome Sequence/Sample
Points to remember on Data Formats • Use raw sequencing data- format when possible • For base-call data, use “standard” FASTQ (Sanger, Phred) • For read alignments, use SAM/BAM format • For annotation results (e.g. GFF or BED format)
Need for QC & Preprocessing • QC analysis of sequence data is extremely important for meaningful downstream analysis • To analyze problems in quality scores/ statistics of sequencing data • To check whether further analysis with sequence is possible • To remove redundancy (filtering) • To remove low quality reads from analysis • Highly efficient and fast processing tools are required to handle large volume of datasets
FastQC and FastX Toolkit • Use FastQC in preliminary analysis • Use FastX-toolkit to optimize different datasets and visualize the results with FastQC
FastQC output • Basic statistics • Quality- Per base position • Per Sequence Quality Distribution • Nucleotide content per position • Per sequence GC distribution • Per base GC distribution • Per base N content • Length Distribution • Overrepresented/ duplicated sequences • K-mer content
FastQC (Box-Whisker plot) Y axis- Quality Score X axis- Base position
Basic Statistics Contains information about • File_type • ASCII encoding quality value • Total sequences, filtered sequence • Sequence length • Percentage GC content
9. Overrepresented/ duplicate sequences Too many duplicate regions in the sequence will be due to sequencing problems
FASTX Toolkit • fastx_quality_stats .txt • fastq_quality_boxplot_graph.png • fastx_nucleotide_distribution.png • QC report.txt
QC Report • Sequence Statistics • Total No. Of Sequences 6970943 • Avg. Sequence Length 54 • Max Sequence Length 54 • Min Sequence Length 54 • Total Sequence Length 376430922 • Total N bases 14254521 • % N bases 3.78676 • No of Sequences with Ns 278635 • % Sequences with Ns 3.99709 • Quality Statistics • Total HQ bases 334195496 • %HQ bases 88.78 • Total HQ reads 6350256 • %HQ reads 91.0961