Download
1 / 22
220 likes | 493 Views
10.2 Variables and Expressions. Variable : · a letter that represents an unknown number ·for example, x, A, n Ex pression : · any single number or variable, or a combination of operations (+, -, x, /) involving numbers and variables ·for example, 5, r , 8 t , x + 9, 2 y - 7

E N D
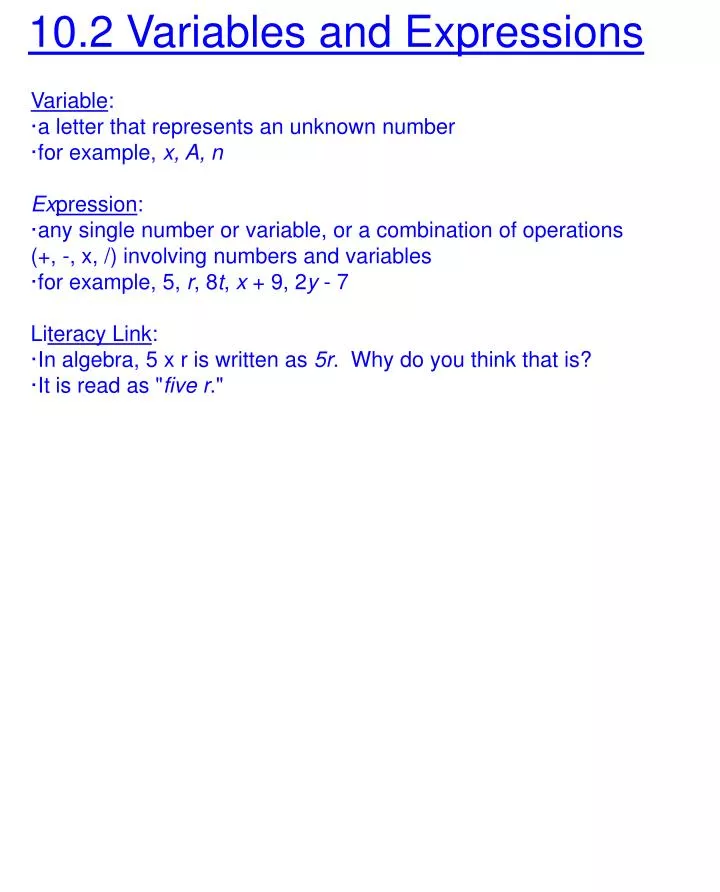
10.2 Variables and Expressions Variable: ·a letter that represents an unknown number ·for example, x, A, n Expression: ·any single number or variable, or a combination of operations (+, -, x, /) involving numbers and variables ·for example, 5, r, 8t, x + 9, 2y - 7 Literacy Link: ·In algebra, 5 x r is written as 5r. Why do you think that is? ·It is read as "five r."
Ex 1: Describe a Pattern Using a Variable A kitchen is being covered with red and white tiles. The basic design is shown. Several of these basic designs fitted together to make a pattern. Design 2 Design 1 Design 3
a) Make a table showing the number of red and white tiles in the first five designs. Describe the pattern. Design 1 Design 2 Design 3 b) Choose a variable and tell what it represents. Then use the variable to write an expression for the number of white tiles. c) How many white tiles will there be if there are 16 red tiles?
More Key Terms Value: ·a known or calculated amount Constant: ·a number that does not change ·increases or decreases the value of an expression Numerical Coefficient: ·a number that multiplies the variable Choosing Variables: ·You can choose any letter as a variable. It can be helpful to choose a meaningful variable. For example, c for cost, d for distance, and t for time.
Ex 2: Describe Patterns Using Expressions a) Three employees work at the food bank. Every day, some volunteers arrive to help out. What is an expression for the number of people working at the food bank? What is the value of the constant? Constant = Coefficient = Variable =
b) Simon creates this pattern of toothpick triangles. What is an expression for the perimeter of any triangle in this pattern in relation to the base? What is the value of the numerical coefficient? Constant = Coefficient = Variable =
c) Theresa is sharing some grapes equally among her 4 friends. What is an expression for the number of grapes each friend gets? Constant = Coefficient = Variable =
Key Ideas ·An expression gives you a simple, quick way to describe a pattern. 3f n + 1 ·Any letter can be used as a variable to represent a number or amount. ·To write a pattern as an expression: Drag: variable constant numerical coefficient ·choose a variable and tell what it represents ·describe the pattern using the variable, numbers, and operations
Assignment p. 361, #1-4, 6, 8, 9, 11, 12, MathLink Still good? #13, 15, 16 Pro Star? #14, 17-19
10.3 Evaluate Expressions Sam is modelling an expression. What do the cups represent? What do the counters represent? I'm using these cups and counters to model 2c + 5.
How can you model an expression?? 1. Let the variable c represent the unknown number of counters in the cup shown in the diagram. What is the expression for the total number of counters shown? + C 2. Put 6 counters in the cup. What is the value for c? 3. How many counters do you have in total? 4. If you substitute c = 6, what is the value of the expression in step 1? Think about it... 5. a) Describe what the cup represents. b) Describe what the three counters represent.
Evaluate means to determine the result or answer of an expression. Ex 1: Evaluate Expressions a) Use cups and counters to model the expression 3x + 2. +
b) Evaluate 3x + 2 when · x = 3 ·x = 4 Method 1: Use Cups and Counters When x = 3 When x = 4 + +
b) Evaluate 3x + 2 when · x = 3 ·x = 4 Method 2: Substitute Into the Expression 3x + 2 When x = 3 When x = 4 3x + 2 = 3x + 2 =
Ex 2: Make a Table of Values Look at the pattern of squares. It can be described using the expression 2n +1, where n is the figure number. a) What does 2n +1 represent? b) Make a table of values for n and 2n +1. Use whole numbers from 1 to 6 for n. c) How many squares are in Figure 30 of the pattern? Fig 1 Fig 2 Fig 3
10.4 Graph Linear Relations After this lesson you will be able to... ·graph a linear relation ·describe the relationship shown on a graph Linear Relation: ·a pattern made by two sets of numbers that results in points along a straight line on a coordinate grid. Graph: ·a visual way to show how two sets of numbers relate to each other. Relationship: ·a pattern formed by two sets of numbers.
Ex 1: Plot Points and Describe Patterns Dr. Seuss often describes patterns in unique ways. He once wrote about a pup in a cup and three fish in a tree. a) Copy and complete the table.
b) Make a graph using the ordered pairs in your table. c) Describe the pattern of points on your graph. Method 1: Describe using words. Method 2: Describe using horizontal and vertical distances. Method 3: Describe using a relationship. 20 Labels? 10 5 10 -10 -5 -5 The pattern of points forms a straight line, starting at (1, 3). The f-coordinate is 3 times the p-coordinate. The points increase by 1 unit to the right, then 3 units up, starting at (1, 3). -10 The number of pups is p. The number of fish is f. The coordinates of the points are (p, f). The relationship between p and f is linear and can be expressed as (p, 3p) or f = 3p.
Ex 2: Describe a Graph to Solve a Problem Armand is four years old. His allowance starts at $2 per week. Each year he will get a $1 per week increase. The graph shows what his total allowance will be after the increase each year. 10 Total Allowance ($) 5 5 10 -10 -5 Age (years) a) Continue the pattern. Make a table of values for the first 6 values of x. b) Describe the pattern of points on the graph. Words: Horizontal/Vertical Distances: Relationship: c) What will Armand's allowance be when he is 15? -5 The pattern of points forms a straight line, starting at (4, 2). The y-coordinate is 2 fewer than the x-coordinate. -10 The points increase by 1 unit to the right, then 1 unit up, starting at (4, 2). The number of years is x. The total allowance is y. The coordinates of the points are (x, y). The relationship is linear and can be expressed as (x, x-2) or y = x-2.
Key Ideas ·Patterns can be shown by listing the ordered pairs in a table of values or by plotting the ordered pairs on a graph. ·Patterns can be described in several ways: Words: The pattern forms a straight line, starting at (0, 0). Each y-coordinate is the same as its x-coordinate. Horizontal and Vertical Distances: The points increase by 1 unit to the right, then 1 unit up, starting at (0, 0). Relationship: The coordinates of the points are (x, y). The relationship is linear and can be expressed as (x, x) or y = x. ·You can use patterns in graphs to solve problems.
Assignment p. 378, #1, 2, 3, 5, 7–10, Math Link Still Good? #11–13 ProStar? #14–15