Download
1 / 23
331 likes | 649 Views
Day 15: Hardenability. Hardenability CCT Curves. Hardenability. We have seen the advantage of getting martensite, M. We can temper it, getting TM with the best combination of ductility and strength.

E N D
Day 15: Hardenability • Hardenability • CCT Curves
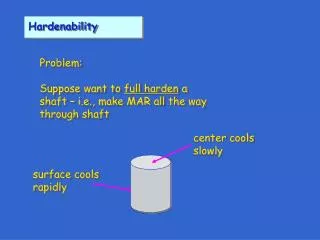
Hardenability • We have seen the advantage of getting martensite, M. We can temper it, getting TM with the best combination of ductility and strength. • But the problem is this: getting M in depth, instead of just on the surface. We want a steel where Pearlite formation is relatively sluggish so we can get it to the cooler regions where M forms. • The ability to get M in depth for low cooling rates is called hardenability. • Plain carbon steels have poor hardenability.
Factors Which Improve Hardenability • 1. Austenitic Grain size. The Pearlite will have an easier time forming if there is a lot of g.b. area. Hence, having a large austenitic grain size improves hardenability. • 2. Adding alloys of various kinds. This impedes the g P reaction. TTT diagram of a molybdenum steel 0.4C 0.2Mo After Adding 2.0% Mo
Jominy Test for Hardenability • Hardenability not the same as hardness!
The Result is Presented in a Curve • Note: • Distance from quenched end corresponds to a cooling rate, and a bar diameter • Notice that some steels drop off more than others at low cooling rates. Less hardenability! Rank steels in order of hardenability.
Hardness and Hardenability Predict the center hardness in a water quenched 3” bar of 8640 Jominy Distance =17mm Water Quenched Oil Quenched
Alloying and Hardenability Hardness at Center of a 3 inch bar is about 42 HRC
Continuous Cooling Transformation • CCT Curves – Here is the one for the 0.77% Eutectoid Composition Steel • What would we get if we cooled at • 150 oC/s • 50 oC/s • 5 oC/s
Another Curve • Here’s One for an Alloy Steel • Note: • Different Microstructures at different cooling rates. • Different microstructures possible in same piece • Comparison with previous steel, note the effects of alloying
In the area of age hardening (precipitation hardening) : • State the factors necessary for age hardening to be possible. • Name the three steps in the age hardening process, the microstructural changes associated with each step, and the relative mechanical properties which result from those microstructures. • compare and contrast age hardening and quench and tempering in terms of procedure, microstructure and properties.
Precipitation Hardening 700 T(°C) CuAl2 L 600 a +L +L A 500 q a+q C 400 300 0 10 20 30 40 50 B (Al) wt% Cu composition range needed for precipitation hardening Temp. Pt A (sol’n heat treat) Pt C (precipitate ) Time Pt B • Particles impede dislocations. • Ex: Al-Cu system • Procedure: --Pt A: solution heat treat (get a solid solution) --Pt B: quench to room temp. --Pt C: reheat to nucleate small q crystals withina crystals. • Other precipitation systems: • Cu-Be • Cu-Sn • Mg-Al Adapted from Fig. 11.24, Callister 7e. (Fig. 11.24 adapted from J.L. Murray, International Metals Review30, p.5, 1985.) Adapted from Fig. 11.22, Callister 7e.
Heat Treating Aluminum Solution Treat Age Quench
f11_22_pg403 f11_22_pg403
f11_23_pg404 f11_23_pg404
Precipitate Effect on TS, %EL • %EL reaches minimum with precipitation time. many small “aged” precipitates non-equil. 30 solid solution fewer large precipitates 400 “overaged” 20 300 tensile strength (MPa) %EL (2 in sample) 10 149°C 149 °C 200 204°C 204°C 100 0 1min 1h 1day 1mo 1yr 1min 1h 1day 1mo 1yr precipitation heat treat time precipitation heat treat time • 2014 Al Alloy: • TS peaks with precipitation time. • Increasing T accelerates process. Adapted from Fig. 11.27 (a) and (b), Callister 7e. (Fig. 11.27 adapted from Metals Handbook: Properties and Selection: Nonferrous Alloys and Pure Metals, Vol. 2, 9th ed., H. Baker (Managing Ed.), American Society for Metals, 1979. p. 41.)
Aging and Overaging • After quenching, there is thermodynamic motivation for precipitate to form. • Precipitates initiate and grow due to diffusion, enhanced by higher temperatures. • To get significant strengthening the precipitate should be coherent • When the precipitates get too large, they lose coherence and strengthening decreases (overaging)
f11_27_pg406 f11_27_pg406
f11_25_pg405 f11_25_pg405
f11_26_pg405 f11_26_pg405
f11_28_pg413 f11_28_pg413