Download
1 / 34
340 likes | 463 Views
Reduction Processes and Community Structure in Remediation of Uranium. Anthony V. Palumbo 1 , Craig C. Brandt 1, Susan M. Pfiffner 2 , Lisa A. Fagan 1 , Andrew S. Madden 1 , Tommy Phelps 1 , Jack C. Schryver 1 Meghan S. McNeilly 1 ,

E N D
Reduction Processes and Community Structure in Remediation of Uranium Anthony V. Palumbo1, Craig C. Brandt1, Susan M. Pfiffner2, Lisa A. Fagan1, Andrew S. Madden1, Tommy Phelps1, Jack C. Schryver1 Meghan S. McNeilly1, Chris W. Schadt1 Jana R. Tarver1, Sara Bottomly2, Heath J. Mills3, Denise M. Akob3, Joel E. Kostka3 1Oak Ridge National Laboratory, E-mail: palumboav@ornl.gov 2University of Tennessee, Knoxville, TN, USA 3Florida State University, Tallahassee, FL, USA
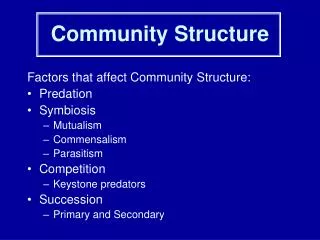
Background • The relationships among microbial community structure, geochemistry, and metal reduction rates in subsurface sediments may be critical in the remediation of metal contaminated environments. • Many microorganisms can change the geochemical conditions so metal reduction becomes an energetically favored reaction while some microbes can directly catalyze the necessary reactions. • In the second case the composition of the community may be important but in the first it is not.
Research Questions • Does microbial community structure affect uranium reduction rates? • Are there donor-specific effects that lead to enrichment of specific community members that then impose limits on the functional capabilities of the system? • Is the metabolic diversity of the in situ microbial community sufficiently large and redundant that bioimmobilization of uranium will occur regardless of the type of electron donor added to the system? • Other questions are addressed in the project but not in this presentation (e.g., humics, resource ratio – P).
Addition of Different Electron Donors Community Structure Uranium Reduction Rate Addition of Phosphate (alter C:P) Geochemistry Addition of Humics Goal The overall goal is to improve our understanding of the relationships between microbial community structure, geochemistry, and metal (uranium) reduction rates. Is uranium reduction more like hydrocarbon degradation or chlorinated solvent degradation?
Approach • We are using triplicate laboratory microcosms for each treatment (ph, substrate, etc) containing sediment and groundwater to address the questions. • Sediments samples were homogenized under anaerobic conditions prior to use in the microcosms. • Each microcosm used 20 g of sediment and 80 mL of groundwater from a uranium-contaminated field site (U distributes between). • Carbon substrate concentrations were adjusted to give equivalent electron donor potential.
FRC Site • Samples were collected from the Environmental Remediation Sciences Program (ERSP) Field Research Center (FRC) located at Oak Ridge National Laboratory. • The site is adjacent to a former disposal pond that has been filled and is now a parking lot. • The FRC is contaminated with uranium and has high levels of nitrate and an acidic pH due to disposal of nitric acid cleaning solutions.
Glove Bag in Field Trailer Experimental Setup • The pH was adjusted using sodium bicarbonate. • Unamended controls were included in each experiment. • Microcosms were incubated in an anerobic glove bag for the smaller experiments (e.g., 15 microcosms). • In the third experiment (96 microcosms) the incubation was on the lab bench.
Experiments • Exp. 1 – Three electron donors & control • archived sediments and fresh groundwater • methanol (20 mM), ethanol (10 mM), glucose (5 mM) and control (no added substrate) – data not shown • Exp. 2 – Three electron donors & control • fresh sediment and groundwater • same donors as Exp. 1 but at twice the concentration (methanol [40 mM], ethanol [20 mM], and glucose [10 mM]) and a control • Exp. 3 – Full factorial (next slide) • Exp. 4 – Three electron donors & humic & control • methanol (20 mM), ethanol (10 mM), glucose (5 mM), ethanol plus humic and control (no added substrate) • Exp. 5. Same as 4 at ½ substrate level • plus methanol and humics
Exp. 3 – Full Factorial Experiment • Similar design to Exp. 2 except we used a full factorial design with pH and substrate. • 7 carbon substrates (and a control) • Methanol (40 mM) • Ethanol (20 mM) • Glucose (10 mM) • Acetate (30 mM) • Lactate (20 mM) • Pyruvate (24 mM) • Glycerol (17 mM) • Control (no added electron donor) • 4 pHs (5.5, 6.0, 6.5, 7.0) • 3 reps/treatment = 96 microcosms Glucose (top) and Methanol Microcosms
Exp. 2 – Nitrate and U Results • No lag times in nitrate reduction with fresh sediments. • No uranium reduction with methanol. • Glucose and ethanol (not shown) exhibited both uranium and nitrate reduction
Nitrate and Uranium Reduction Rates • Fastest rates of U reduction with glucose. • Substantial nitrate and U reduction with ethanol. • Nitrate but no U reduction with methanol.
Exp. 2 – Community Structure by Hierarchical Cluster Analysis of PLFA Data • Two major clusters: (1) high U red rate(2) no U reduction • Control 2 and the fresh sediment are very different lower biomass (1) High U Red. (2) No U Red. Control FreshEthanol GlucoseMethanol Control
Treatments tend to be similar. One control (2) is consistently different than the other two controls. High U reduction treatments (ethanol and glucose) separate from control and methanol (also by cluster analysis). Exp. 2 – Community Structure by Principle Components Analysis of PLFA Data No U Reduction
Stress in Methanol and Control Treatments • PLFA biomarkers indicate nutritional stress in the methanol treatment and the control treatments was indicated by the cyclopropyl to monounsaturated fatty acid ratio • There also appears to be a potential toxicity stress in the methanol treatment indicated by the trans/cis ratio of monounsaturated fatty acids
Exp. 3 – Nitrate Results (averaged over pH) Results consistent with earlier studies • Nitrate reduction is rapid • Differences among substrates are small • Methanol lags • Glucose, ethanol, lactate rapid • Minimal to no effect of pH (data not shown) • No uranium loss in control, methanol, or pyruvate (actual increases observed)
Exp. 3 – Community Structure by PLFA There are community differences among treatments – methanol and pyruvate cluster and don’t reduce uranium Low U Red High U Red Low U Red High U Red
Exp. 4 – Nitrate Results • Nitrate reduction starts without a long lag • Reduction slowest for methanol • All complete by 15 days • No difference with humics
Exp. 4 – Uranium and Sulfate • Uranium reduction lags behind nitrate reduction • Sulfate reduction lags U reduction • No uranium reduction seen for methanol • Very slow sulfate reduction with methanol • No detectable difference with ethanol + humic
Uranium Valence by X-ray Absorption Spectroscopy of Sediments from Microcosoms • Kelly and Kemner (Adv. Photon Source at ANL) working with A. Madden • Glucose end point • 83 ±8 % U(VI) • 17 ±8 % U(IV) • Ethanol end point • 96 ±4 % U(VI) • 4 ±4 % U(IV)
U in solution (all) plus some in sediment is reduced Microcosms – 4:1 liquid:solid; initially ~1.5 ppm U(aq) Partial reduction in sediments is consistent with literature (e.g., Ortiz-Benard et al. 2004 AEM) and results reported for FRC experiments 17% for glucose 4% for ethanol – need more replicates Average total solid phase U ~96 ppm Moon et al. JEQ (in press)
Primary electron donor is consumed quickly Acetate tends to accumulate over time and persist till end of experiment Acetate is present in high concentrations at the FRC site (S. Brooks) Donor Consumption and Metabolite Formation
Ethanol Glucose Exp. 4 – Community Structure by T-RFLP Breaks into two major groups • Ethanol above • Glucose below
Exp. 4 – Community T-RFLP Results Ethanol Actinos dominate Glucose More α and β Proteobacteria
Research Questions • Are there donor specific effects that lead to enrichment of specific community members that then impose limits on the functional capabilities of the system? • Yes – methanol (and pyruvate?) imposes limits. • Is the metabolic diversity of the in situ microbial community sufficiently large and redundant that bioimmobilization of uranium will occur regardless of the type of electron donor added to the system? • There is enough metabolic diversity to accommodate many different electron donors (e.g., glucose, ethanol, glycerol, acetate) for U reduction but perhaps not all.
Summary • Consistent results in the experiments indicating: • all substrates promoted nitrate reduction, • methanol (and pyruvate) did not promote U reduction but glucose and ethanol promoted rapid U reduction, • PLFA indicated different communities with methanol • T-RFLP indicated distinct differences among communities even in treatments that promoted U reduction • there appear to be limitations imposed on the community related to some substrates (e.g. methanol). • Limited pH effects • Donor levels critical (Exp. 5 data not shown) • Further data and analysis of the community structure is on going (e.g. functional gene arrays, T-RFLP, clone libraries) • Additional studies will take place with glucose, ethanol, and methanol with humics and different C/P ratios.
Acknowledgements • This research is funded by the Environmental Remediation Science program (ERSP), Biological and Environmental Research (BER), U.S. Department of Energy. • Oak Ridge National Laboratory is managed by UT-Battelle, LLC for the U.S. Department of Energy under contract DE-AC05-00OR22725. • We thank the organizers of the meeting for the opportunity to present this ongoing work.
Ethanol Lactate and Glucose achieve relative high rates of U reduction (and N). Little or no reduction in control, methanol, pyruvate. Results similar across experiments. Maximum Loss of U Related to Substrate *Bars labeled with the same letter are not significantly different than each other
Increases could be related to kinetic effects on equilibrium in slurries, reoxidation due to nitrate, leakage of air into microcosms. No loss in control or methanol. Pyruvate starts very high and continues to increase (data not shown). Next experiment will be incubated in anaerobic chamber and with better stoppers. U over time (averaged over pH)
Analytical Methods • Nitrate was measured spectrophotometrically on diluted samples using Szechrome reagents (Polysciences) in Experiment 1 and the HACH method in the second and third experiments. • A Chemchek KPA (kinetic phosphorescence analyzer) was used to measure the uranium in diluted samples from both experiments. • Measurements of pH were made with a small electrode on 1 ml samples from the microcosms.
Rate Calculations, Statistics, and Community Structure • Reduction rates were calculated from the linear portions of the plots of loss of nitrate and uranium from solution. • SAS was used for ANOVA and PCA. • We made limited measurements of community structure at the final time point of experiment 2 using membrane lipid techniques. • Other community analysis is ongoing.
Exp. 4 – Sulfate Results • Sulfate reduction lags behind nitrate and U reduction • Very slow response for methanol • No detectable difference with Ethanol + Humic
Some pH effect especially between 7 and 5. Some interactions due to differences among substrates in potential for reduction. Two Views of U Loss Related to pH *Bars labeled with the same letter are not significantly different than each other
Exp. 1 – Nitrate Results • Ethanol resulted in faster nitrate reduction and shorter lag time than did glucose and methanol additions. • No U reduction was evident in the methanol treatments (data not shown).