Download
1 / 26
260 likes | 425 Views
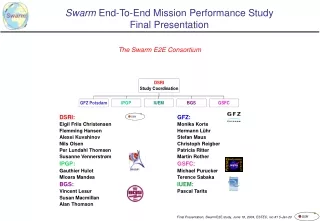
swarm End-To-End Mission Performance Study Progress Meeting 2 Draft Task 2 Report. Nils Olsen Danish Space Research Institute Copenhagen. swarm Progress Meeting 2. Draft Agenda 10:00 - 13:00 Welcome Presentation of the Final Task 1 Report Changes w.r.t. Draft Ta s k 1 Report

E N D
swarm End-To-End Mission Performance StudyProgress Meeting 2Draft Task 2 Report Nils Olsen Danish Space Research Institute Copenhagen
swarm Progress Meeting 2 Draft Agenda • 10:00 - 13:00 Welcome • Presentation of the Final Task 1 Report • Changes w.r.t. Draft Task 1 Report • Presentation of the Draft Task 2 Report • Description of forward approaches and data products • Test plan • Preliminary results of tests • Next constellation • Future work • 13:00 - 14:00 Lunch • 14:00 - 15:00 General discussion • 15:00 Adjourn
Final Task 1 Report • Changes on pages 10-11, as discussed at PM1 • ”Note that - although the start time of t is defined in UT - the time scale of t is continuous and does not include leap seconds.” • ”The magnetic scalar field F can be calculated from the vector components by means of In Matlab this transformation is done with the command F=sqrt(B(:, 1).^2 + B(:, 2).^2 + B(:, 3).^2).” • Updated Figure 3.3 • Final Task 1 Report available at www.dsri.dk/swarm/swarm_E2E_Task_1.pdf
Orbit Design Initial Constellation # 1 • Two pairs of satellites450 and 550 km initial altitude86.0° and 85.4° inclination • lower satellites are close together separation a few hundred km • upper satellites are at antipodal position 180° separation • Different inclinations yields different drift rates0.44 min/day differential drift rate corresponding to 90° separation after 27 months
Outline of Task 2 (red boxes are part of Task 3)
Magnetic Field Generation • From the Comprehensive Model CM4(Sabaka et al) • High-degree crustal field and secular variation from synthetic model(since reliable high-degree models do not exist)
High-degree crustal field High-degree crustal field from • MF-2 (Maus et al) • CM4 (Sabaka et al) • synthetic model based on extrapolation of MF-2 spectrum • degrees n=110-120 are tapered to zero
High-degree secular variation • Same approach as for high-degree crustal field is used for deriving a model of the high-degree secular variation • CM4 describes SV by splines (n=1-13) • n=14-19 are assumed to vary linearly in time for 1997-2001coefficients are derived from synthetic model, based on spectrum of mean SV of the last 20 years (difference between an Ørsted and a Magsat model)
Data Product: 1 min Positions • Input • Kepler elements of launch data • Auxiliary data (Ap, F10.7, ...) • Module • EPOS (Earth Parameter & Orbit System) software developed by GFZ • Integration of 3 month segments, for swarm 1 (high) and swarm 3 (low) • Swarm 2 is found from swarm 1, swarm 4 from swarm 3 by position shift • Re-order into daily files • Problems found • Drift of swarm 3 w.r.t. swarm 4, gives 5000 km separation at end of mission(instead of anticipatedx 500-1000 km separation) • Initial altitude a few km higher than anticipated (height above equatorial radius 6378.2 km rather than mean radius 6371.2 km) • Status • Error solved, new data provided as swarm 5 • Module requires manual interaction, at present not running automatically • Providing data for one constellation takes a few days
Data Product: 1 min Magnetic Field Values • Input • Time • Position (from orbit files) • Dst (hourly) • F10.7 (daily) • Describes Main Sources of Geomagnetic Field • Core field + SV (splines for n=1-13, linear for n=14-19) • Lithospheric field • Magnetospheric primary + induced • Ionospheric primary + induced • Toroidal field (due to in-situ electric currents) • Module(s) • CM4 forward code • High-degree linear SV (n=14-19) • High-degree crustal field (n=30-120), linear 3D interpolation • Problems found • Latitude/longitude has to be given with 1e-5 deg (instead of 1e-3 deg)resolution • Error in 3D interpolation (0...360 longitude was mapped to 0...359.25 longitude) • Status • Errors solved, new data provided at ftp.dsri.dk/swarm/E2E/constellation_1/1min/ • Module is able to run on routine basis • 1.5 hr CPU time for 1 year and 1 satellite
Data Product: 5 sec Magnetic Field Values • sampling rate higher than 1 min required for lithospheric + ionospheric studies • Input and approach as for 1 min values • Spline interpolation of positions (X,Y,Z) from 1 min to 5 sec values • Status • data provided at ftp.dsri.dk/swarm/E2E/constellation_1/5sec/ • Module is able to run on routine basis • 30 hrs CPU time for 1 year and 1 satellite (4 CPU weeks for one constellation!)
Data Product: Auxiliary Data • Time series of geomagnetic indices for simulated mission (1997-2001) • Kp (3-hourly) • Dst (hourly) • RC (hourly) • from synthetic observatory data, to be used instead of Dst for the inversion • F10.7 (daily) • Time series of magnetospheric expansion coefficients for induction studies • Synthetic observatory mean values (all CM4 contributions) for 88 observatories • Provided in WDC standard data format • Input models • Time series (1 month sampling rate) of main-field SH coefficients (n=1-13) • High-degree linear SV coefficients (n=14-19): swarm_02a_03.cof • Crustal field coefficients (n=14-120): swarm_02a_03.cof • ”observatory biases” (unmodeled high-degree crustal field contributions)
Data Product: Magnetic Field due to Ocean Tides • Magnetic field due to 10 tidal modes (M2, S2, N2, K2, K1, O1, P1, Q1, Mf, Mm) • Input • ocean tidal model of Erofeeva and Egbert [2002] • model of electrical conductivity of oceans, sediments and mantle • Module • code for 3D induction in sphere • Data product: Daily files with 1 min values • Time • Position • (Br, Bq, Bf) for all 10 modes separately • Status • Model calculations done, SH coefficients for all modes obtained • Program for synthesis at satellite position is in progress
Data Product: Ionospheric Currents • Ionospheric sheet current densities, in combination with a model of ionospheric conductance (height-integrated conductivity) allows for a determination of the electric field at satellite position • Gives an electric field that is consistent with magnetic field data • works only at middle latitudes, not at polar or equatorial latitudes • Extension to equatorial and polar latitudes is part of a suggested science study • Ionospheric sheet current density calculated by CM4 • Requires tracing from satellite position down to ionosphere along field-line • Dipole approximation is used • Data will be provided as 5 secs values • Status • CM4 forward code modified to deliver ionospheric sheet current density • modules for geographic / dipole coordinates and for field-line tracing ready and tested • Module integration and test is outstanding • Time consuming, probably 30-60 hrs CPU time for one year and one satellite
Data Availability Synthetic data, 1 min sampling rate, containing the various source contributions(available at anonymous ftp.dsri.dk/swarm/E2E/) Example: constellation #1, satellite #1, 01 Jan. 1998: ftp.dsri.dk/swarm/E2E/constellation_1/swarm1_1_980101.dat • % swarm synthetic data, Constellation #1, file created on: 05-Mar-2003 16:29:26 • % t(MJD2000) r theta longitude B_r B_theta B_phi • % | MF+SV | • % • -730.00000000 6920.907 9.277 95.822 -45362.24 -2601.88 942.57 • -729.99930556 6920.868 6.100 111.100 -45207.53 -1794.31 781.69 • -729.99861111 6920.899 4.088 148.112 -45091.27 -1147.72 881.21 • -729.99791667 6921.000 4.957 195.981 -45051.67 -842.71 1101.00 • % swarm synthetic data, Constellation #1, file created on: 05-Mar-2003 16:29:26 • % t(MJD2000) r theta longitude B_r B_theta B_phi B_r B_theta B_phi B_r B_theta B_phi B_r B_theta B_phi B_r B_theta B_phi B_r B_theta • % | MF+SV | crustal field | magnetosph. | magnetosph. induced | ionosph. | ionosph. indu • % • -730.00000000 6920.907 9.277 95.822 -45362.24 -2601.88 942.57 1.16 4.13 -3.49 -26.23 11.70 -2.71 3.36 0.82 -1.21 -4.88 -5.91 -5.83 1.32 0.40 • -729.99930556 6920.868 6.100 111.100 -45207.53 -1794.31 781.69 6.77 0.84 1.27 -27.14 9.11 -4.72 3.54 0.36 -1.32 -7.90 -7.69 -5.42 1.33 0.90 • -729.99861111 6920.899 4.088 148.112 -45091.27 -1147.72 881.21 2.47 0.85 8.90 -27.95 3.79 -7.47 3.70 -0.57 -1.13 -9.85 -9.17 -2.15 1.25 2.04 • -729.99791667 6921.000 4.957 195.981 -45051.67 -842.71 1101.00 -9.81 5.19 3.90 -28.65 -2.06 -6.01 3.84 -1.15 -0.17 -9.26 -9.31 2.85 1.06 2.55 - • -729.99722222 6921.170 7.797 218.756 -45101.06 -1167.49 1331.94 -9.79 -3.46 -3.29 -29.19 -2.57 -3.36 3.94 -0.98 0.42 -6.70 -9.18 4.81 0.78 2.30 - • -729.99652778 6921.408 11.197 228.529 -45222.56 -1799.95 1636.41 -0.93 -5.20 -3.75 -29.53 -1.13 -1.74 4.00 -0.71 0.69 -3.31 -8.79 5.10 0.47 2.09 - • Synthetic hourly mean values (88 observatories, WDC format, yearly files) • Indices: Kp, F10.7 (daily +monthly), (Dst), RCTime series of magnetospheric expansion coefficinets (1 hr sampling rate) • Input models: coefficient file swarm_02a_03.cof (n>13) • time series of MF (n < 20) coefficients in steps of 1 month
Draft Test Plan • Test of the forward and inversion approaches using noise-free data • Focus on field contributions that are main swarm objectives • Core field and secular variation • Lithospheric field • Recovery of • core field (plus SV) from data that only contain core field (+ SV) • lithospheric field from data that only contain lithospheric field • Test quantities: Difference between recovered and original SH coefficients • Power spectrum of the model difference • Squared coherency coh2 • Sensitivity matrix • Global Maps (e.g., of Br) of the model difference
Test: Recovery of Lithospheric Field • 400 days of data from swarm 3 • Only lithospheric part of synthetic data • Using all 3 vector components and Br only, respectively • LS solution of a N=120 static internal field model Test quantity: Squared Coherency between recovered and original model
Test: Recovery of Lithospheric Field (contd.) Test quantity: Sensitivity Matrix (normalized difference of the model coefficients) using Z only using all 3 vector components
Test: Recovery of Lithospheric Field (contd.) Test quantity: Maps of Br, obtained from the difference of the model coefficients using Z only using all 3 vector components Note the polar gap!
Test: Recovery of High-Degree Secular Variation • 2 years of data from all 4 satellites • Only core field part of synthetic data • Solving for • N=20 static • N=20 linear time changing and • N=8 quadratic time changing internal field model Spectrum of model difference Difference in model coefficents Squared coherency
Test Results Successful test of • forward scheme and synthetic data • inversion schemes for core field (+ SV) and lithospheric field from noise-free data Next step: inversion using data that contain other source contributions
Road-Map for Comprehensive Inversion • Analysis using Dst and dailyF10.7 (same as for production of synthetic data) • using satellite data only • data containing core and crustal fields • data containing core, crust and magnetospheric fields • data containing core, crust,magnetospheric and toroidal fields • using satellite and observatory data • using only 2 years of data • using data spanning the whole mission • Analysis using RC and monthly values of F10.7 • Preliminary results of a full inversion (using RC and monthly values of F10.7)
Deadlines • Study spans 12 months: May 1, 2003 – April 30, 2004 • Progress Meeting 1 on June 16, 2003 (at ESTEC) • Delivery of Draft Task 1 report + ”Industrial Module” • Progress Meeting 2 on September 29, 2003 (at DSRI) • Delivery of Draft Task 2 report • Working meeting on Sept 5 • Input to report: September 17 • Mid-Term Review (MTR), November 11, 2003 (at DSRI) • Final Task 1 and Task 2 reports • Input: Monday, November 3 • Progress Meeting 3 (Jan/Feb 2004 at IPGP)
Study Logic and Distribution of Work --- Task 1 --- -------------------- Task 2+3 ------------------------------
Constellation # 1 (cont.) launch after 4 yearsred 550 km 540 kmyellow 450 km 380 km • Varying local time and local time differences during mission lifetime, for studying the various science objectives lithospheric studies extended lithospheric studies core field modelling and induction studies extended misison 550 km initial altitude450 km initial altitude