Download
1 / 18
180 likes | 328 Views
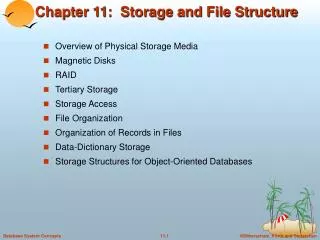
Financing Carbon Capture and Storage : Risks, Creditworthiness, Capital Availability, and Insurability. Swami Venkataraman, CFA Director Utilities and Infrastructure Ratings Standard & Poor’s. April 2, 2008. The Power and Auto Sectors – A study in Contrast. Source: Shell International Ltd.

E N D
Financing Carbon Capture and Storage: Risks, Creditworthiness, Capital Availability, and Insurability Swami Venkataraman, CFA Director Utilities and Infrastructure Ratings Standard & Poor’s April 2, 2008
The Power and Auto Sectors – A study in Contrast Source: Shell International Ltd.
The Power and Auto Sectors – A study in Contrast Source: Shell International Ltd.
Climate Change – The Big Picture • Scientific CO2 target of 450 – 550 ppm • 50-yr timeframe is appropriate • Developing countries modeled to grow by 60-80%
Climate Change – The Big Picture What does one wedge mean?
Climate Change – The Potential for CCS In most scenarios for stabilization of atmospheric greenhouse gas concentrations between 450 and 750 ppmv CO2 and in a least-cost portfolio of mitigation options, the economic potential23 of CCS would amount to 220–2,200 GtCO2 (60–600 GtC) cumulatively, which would mean that CCS contributes 15–55% to the cumulative mitigation effort worldwide until 2100, averaged over a range of baseline scenarios -- IPCC Special Report on CCS Worldwide Storage Potential (bil. tons of CO2) Storage site Theoretical potential Deep ocean 5,100-100,000 Deep aquifers 320-10,000 Depleted gas reservoirs 500–1,100 Depleted oil reservoirs 150–700 Source: International Energy Agency
Three modes of Carbon Capture • Postcombustion • Remove CO2 from flue gas of convcentional coal plants • Not proven at utility scale – largest industrial application 800 tpd • High capital costs and energy use (about 25-40% parasitic load) • Precombustion • Used in coal gasification • Commercially proven in Chemicals and Refineries, not yet in IGCC • Great Plains Synfuels in N.Dakota captures 2 mill tpy • Most promising option. IGCC parasitic load ~ 12-20% • Oxyfuel Combustion • Substitute Oxygen for air in boiler of traditional coal plant • Only in pilot stage • Capture currently most viable from gas production and chemical industries
Three Ways to Sequester Carbon • Geological Storage Source: MIT white paper on carbon capture and sequestration, January 1997 • Ocean Storage - Negative environmental effects poorly understood • Direct Utilization – Conversion to other solid compounds or artificial photosynthesis still very expensive and in R&D stage
State of the Markets • Well established need for baseload capacity starting in the next decade • Past capacity additions displayed clear trends – Preponderance of Coal, Nuclear or Gas in different times • Today, several forces are pulling in different directions • Volatile and high gas prices => nuclear and coal ; Gas • Concerns over global warming => natural gas, nuclear and renewables ; Coal • Rising utility Bills => energy efficiency new plants, renewables • National Security => coal, ethanol LNG, Nuclear • Sharply Rising Construction Costs • Equipment costs are rising due to global demand • Labor availability is scarce • EPC Contract terms are less favorable
Technology Cost Comparison • Key Variables • Level of reduction required in climate law plus energy efficiency response • How much nuclear can be built? • Incentives for solar and wind not incorporated; neither are integration costs • Gas price response • Reliability vs Green vs National Security
CCS – CO2 EOR Operations are Highly Profitable • CO2 EOR accounted for about 1/3rd of 650,000 bpd EOR production in 2007 • Mainly in the Permian Basin • Source: Denbury Resources • High profitable at $100 Oil • 65-70% of costs are variable; profitable at lower prices too • Tax Credits at Oil below $42 • Industry open to man-made CO2 sources
CCS – Legal and Regulatory Risks are Paramount Regulation • Legal and Regulatory risks perhaps more important than economics • State vs Federal – Clear Regulatory control required • Will CCS continue to be treated as Class V for permitting? • Explicit and rigorous regulatory process with public and political support essential Liability • Responsibility for long-term safety of gases • Nuclear power or Asbestos – Which is the appropriate analogy? • Clear protocols for site selection, injection, operations, monitoring and eventual transfer of custody • Insurability and minor leaks
Technology Cost Comparison Global Assumptions
Analytic services and products provided by Standard & Poor’s are the result of separate activities designed to preserve the independence and objectivity of each analytic process. Standard & Poor’s has established policies and procedures to maintain the confidentiality of non-public information received during each analytic process.