Download
1 / 34
340 likes | 539 Views
First identified as an agent of stratospheric ozone depletion in 1970 (Crutzen et al., 1970). Sample GC chromatogram for N 2 O Analysis. Nitrous Oxide: Mean atmospheric concentration of 300 ppb.

E N D
First identified as an agent of stratospheric ozone depletion in 1970 (Crutzen et al., 1970).
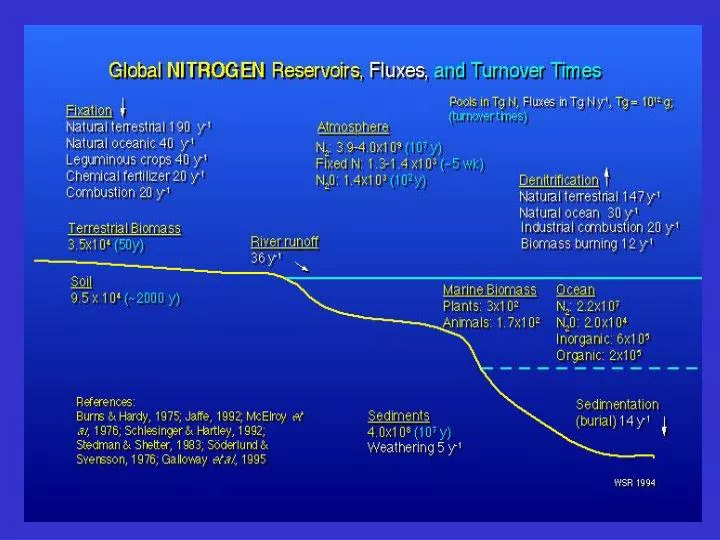
Nitrous Oxide: Mean atmospheric concentration of 300 ppb. Each molecule of nitrous oxide has the potential to contribute 200-fold to greenhouse effects relative to each carbon dioxide molecule. Residence time of about 120 years. Only sink for N20 is by photodissociation. N2O + hv N2 + O UV - (180-240 nm) N20 + O 2NO
Concentrations of nitrous oxide in the atmosphere are increasing at about 0.2 to 0.3 % per year. Total annual global source of 10-17 Tg N. Both fossil fuel burning and the direct impacts of agriculture fertilization have been considered and rejected as the major source. Rather, there is a developing consensus that a wide array of human-driven sources contribute to enrich the terrestrial nitrogen cycle.
Examples of such sources include: fertilizers, nitrogen-enriched groundwater, nitrogen-saturated forests, forest burning, and even manufacture of nylon (adipic acid), nitric acid (in fertilizer made by oxidizing ammonia with platinum catalyst), and other industrial products.
Nitrogen saturation: In theory, when an ecosystem is fully N saturated its soils, plants, and microbes cannot use or retain it any more and all new N deposits will be dispersed to streams, groundwater, and the atmosphere. As ammonium builds up in the soil, it is increasingly converted to nitrate by bacterial action. The buildup of nitrate enhances emissions of nitrous oxide from soils (Vitousek et al., 2000).
Nitrification • 2-step process: ammonium-nitrite-nitrate • NH4+-->NO2--->NO3- • Why important? • a. source of N for plants • b. nitrification and NO3 influence N losses from ecosystems (in several ways) • Who does it? • a. chemoautotrophic bacteria • NH4 is energy source • O2 is electron acceptor • CO2 is C source • b. heterotrophic nitrifiers: may be important in forest soils.
Nitrosomonas spp. The biochemical reaction is: NH2OH + HNO2 ===> NO2.NH.OH + 2[H] ===> to cytochrome system hydroxylamine + nitrous acid -> nitrohydroxylamine Next stage is a direct oxidation step: NO2.NH.OH + 1/2 O2 ===>2HNO2 nitrohydroxylamine, nitrous acid Note that molecular oxygen is involved in the reaction; this is why the process is obligately aerobic.
Nitrobacter spp. On paper a very simple reaction that involves the cytochrome system; NO2-.H2O+ 2cyt.Fe+++ =====>NO3- + 2cyt.Fe++ + 2H+ Then the cyt.Fe+++ is regenerated by: 2cyt.Fe++ + 2H+ + 1/2 O2 =====>2cyt.Fe+++ + H2O This whole process is the removal of electrons from a hydrated nitrite ion.
Major controls nitrification • O2 • NH4 • inhibited at pH <4.5 • inhibitor compounds? • nitrification originally thought to be unimportant in forests; based on small pool sizes of NO3; rapid cycling • 5. Fates of NO3 • plant uptake • microbial uptake (assimilatory reduction; but they prefer NH4) • leaching (groundwater pollution a problem in ag. regions) • denitrification
Denitrification • 1. production of NO (nitric oxide), N2O (nitrous oxide), and N2 gases • NO3-->NO-->N2O-->N2 • 2. why important? • pathway of loss from ecosystems • NO is very reactive in atmosphere • at high NOX: CO-->Ozone ("smog") with light • oxidizes to HN--> acid rain • regulates OH radical concentration (main atm. sink for CH4) • N2O not reactive but important greenhouse gas • gaseous forms can be transported and fall as dry or wet deposition.
3. who does it? • denitrifers: variety of organisms, including heterotrophic bacteria using NO3 as electron acceptor instead of O2. • nitrifiers: NO and N2O can be produced as by-products of nitrification • 4. Controls: a. O2 is preferred e- acceptor; will not happen in its presence. • b. availability of reduced C as energy source • c. NO3- availability • High availability of e- acceptor (NO3-) relative to e-donor (C): incomplete reduction and high N2O:N2 • High availability of e- donor (C) relative to e-acceptor (NO3-): more complete reduction and low N2O:N2.
NITRIFICATION DENITRIFICATION Obligate Aerobic Facultative anaerobic Chemoautotrophic Heterotrophic Requires CO2 for C source Requires organic carbon for carbon source Gain energy from inorganic reactions Use organic carbon for energy source "Inhibited" by excess carbon (see text) Requires organic carbon source Well defined taxonomic group Variable group - many members from many different genera. Reversible Not reversible
Nitrous Oxide in the Ocean: 1 to 5 Tg N of nitrous oxide from the ocean each year. Dominant pathway still remains controversial. The prevalent view established in the 1980s and prevalent today is that nitrous oxide is formed by nitrification processes in oxygenated water and consumed by denitrification in anoxic zones. Other studies uphold denitrification as the primary pathway for nitrous oxide formation. Difficult to reconcile this pathway with the high oxygen concentrations of the open ocean. May be due to anaerobic microsites (Yoshida et al., 1989).
Wahlen and Yoshinari (1985) noted that isotopic analyses of N signature of nitrous oxide may reveal sources (nitrification and denitrification result in different N-15 signatures). Has led to more confusion about interpretation of N-15 enrichment with depth (Naqui et al., 1998).
STRATOSPHERIC OZONE and CHLOROFLUOROCARBONS (CFCs) • Spray-can propellants, foams, refrigerant fluids/solvents • Practically inert in troposphere most prominent spp. are CFCl3(0.17 ppb) and CCl2 F2(0.29 ppb) • not soluble in water • MRT= 80 -170yrs • Like N2O and CH4-gradually diffuse into stratosphere. • 1987 - Ban on production of CFCs • Stratosphere is a major sink for chlorine compounds - become photolyzed and influence stratosphere chemically, especially the ozone layer
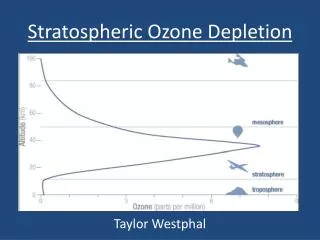
C.F. Schonbein discovered ozone in 1840 - from Greek work “ozein” “to smell” In troposphere O3 troggers free radical chemical reactions in stratosphere - it’s maij domain is in the region of 30 km where it filters out UV. Chapman Reactions: O2 + hv O + O (formation of ozone at 180-240 nm) O + O2 + M O3 + M M = inert molecule such as N2 that eneables the rxn. To take place by reducing “momentum” of collision.
Most common destructive mechanism for ozone is the photodissociation of O3 where UV is absorbed: O3 + hv O2 + O (ozone breakdown at 200-320 nm) O + O3 2O2 Net reaction - 2O3 +hv 3O2 Naturally there is a loss in ozone in the stratosphere over Antarctica.
Hydroxyl Radical: Hydroxyl radical has a mean concentration of 7.7 x 10 5 cm-3 with higher concentrations in daylight. O + H2O2OH can further react to produce H2O2, however very short-lived in atmosphere. OH radical are the major oxidizing source in the troposphere. Methane and carbon monoxide can be converted to carbon dioxide via OH reactions.
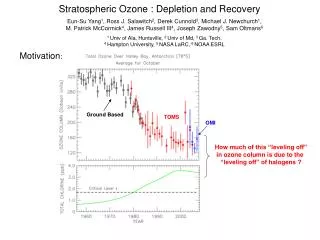
In 1970s dramatic decrease in ozone minimum was observed. Nibus-7 measured decrease in Dobson units - integrated measure of ozone concentration in vertical column of air measured from ground up.
Development of the Antarctic ozone hole. (a) Maps of the Antarctic ozone hole in October 1987 and 1990 from polar orthographic projections of TOMS(Total Ozone Measuring Spectrometer) data from the Nimbus 7 satellite. (b) The seasonal variation of ozone (in Dobson units) at Halley Bay, Antarctica, for two different time periods.
Atomic chlorine - formed by photodecompostion of CFCs - combines with oxone to produce CIO (chlorine monoxide), via a series of rxns Cl is regenerated proving to be a catalyst: 2Cl + 2O3 2ClO + 2O2 ClO + ClO Cl2O2 Cl2O2 2Cl + O2 Net Reaction = 2O3 3O2 Thus, ClO and O3 anitcorrelate because destruction of O3 produces ClO
Evolution of the anticorrelation between ClO and O3 across the Antarctic polar vortex from 8/23/87 to 9/16/87
Atomic Br also acts a catalyst but is far less abundant than Cl Br + O3 BrO + O2 Cl + O3 CLO + O2 BrO + ClO + light Br + Cl + O2 CH3Br - largest source due to biomass burning, agricultural pesticides, and from marine phytoplankton. Mixed halogens as well, CF3Br, CF2BrCl
Polar Stratospheric Clouds (PSCs): Basically, NOx gases freeze to form particulates. At approximately -78C H2O + HNO3 condenses on sulfate aerosols (Polar Vortex). Atomic Cl reacts with CH4 and NO2 to form HCL and CLNO3, this complexes CL and precludes further breakdown of O3. However, PSCs (HNO3 + H2O) provide active surfaces that can catalyze breakdown of HCL and CLNO3.
Tropospheric Ozone: Ozone forms from a combination of volatile organic compounds (VOCs), NOx, and CO - all from combustion by automobiles, industry and biomass burning. As a result of photochemical rxns: R = peroxyacyl nitrtates (PANs) RO2 + NO NO2 + RO NO2 + hv NO + O O + O2 + M O3 + M