Download
1 / 27
270 likes | 411 Views
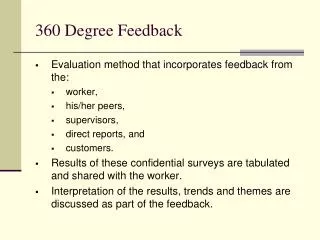
CEO 360 Degree Perspective The Prospect for Renewable Energy MENA. October 2009. Agenda. Introducing the Frost & Sullivan CEO 360 perspective The World & The MENA region – A macroeconomic overview The MENA Energy Industry Current status Trends

E N D
CEO 360 Degree PerspectiveThe Prospect for Renewable Energy MENA October 2009
Agenda • Introducing the Frost & Sullivan CEO 360 perspective • The World & The MENA region – A macroeconomic overview • The MENA Energy Industry • Current status • Trends • MENA – where does Renewable Energy stand today • The road ahead
Economic Trends & Issues Growth Process Emerging Technology Competitive Benchmarking ExternalIndustryImpact Emerging Competition CareerDevelopment Emerging Opportunities New Applications Cultural IndustryIntegration Non Customer Economic Trends Demo- graphics Political & Regulatory Industry Convergence EconomicThreats Disruptive Technologies Industry Expansion Potential IndustryShifts Behavior Competitor’s Customers Country Risk Competitive Strategy In-Direct Competition Growth Functions GrowthTeam The CEO’s Perspective of the Complex Business Universe TECHNOLOGY TECHNOLOGY Identify geographic expansion opportunities, monitor the political and regulatory effects of doing business in another country; understand cultural implications and requirements Ensure a solid understanding of emerging technologies: affects and opportunities; plan for potentially disruptive technologies; leverage new products and/or applications for growth Maintain an effective Growth Plan for 3 - 5 years in the future; create and develop the Growth Team; ensure Growth Team members understand their functions and contributions to growth; leverage industry Growth Thought Leaders and best practices. BEST PRACTICES BEST PRACTICES GLOBAL GLOBAL INDUSTRY INDUSTRY CEO Maintain a solid grasp of your key industries and the industries that could have an impact on your business; identify factors that are causing new trends and changing buying behaviours; address industry convergence and integration; identify opportunities to expand within the market Identify unmet needs; tailor products and services to market needs; manage brand equity; identify emerging customer segments; keep track of changing cultural trends CUSTOMER CUSTOMER COMPETITIVE COMPETITIVE Know any and all emerging competition; identify alliance partners; benchmark your growth against the industry; refine competitive strategy; monitor market perceptions, changing processes, technologies, culture, etc. Pinpoint current and future economic trends; identify growing customer segments; take advantage of emerging opportunities; adjust for currency changes ECONOMIC ECONOMIC
The World and MENA Region: Macroeconomic Scenario
Growth Trends by Region, 2009 -2010 Europe : Weak recovery trends to continue in 2009, growth to gain momentum in 2010 2009 -4.1 % 2010 0.4% North America : Early Signs of Recovery, Growth may be Sluggish 2009 -3.1 % 2010 1.7 % China : Early Recovery Signs, Growth to gain momentum 2009 8.5 % 2010 9.0 % Japan : Expected to bottom out in 2009 2009 -5.4 % 2010 1.7% North America 23% Europe 25 % Japan 7 % China 7 % MENA 3% India 2 % Latin America: Early Recovery Signs, Growth to gain momentum 2009 -0.9% 2010 2.9% MENA : Early Recovery Signs, Growth to gain momentum 2009 2.2 % 2010 4.0 % India : Early Recovery Signs, Growth to gain momentum 2009 5.4 % 2010 6.4 % Latin America 4% Note : Numbers below regions indicate % of Global GDP
IRAN GDP : 344.8 GDP Growth: 2.5% KUWAIT GDP : 158.1 GDP Growth: 6.3% LIBYA GDP : 100.1 GDP Growth: 3.4% MOROCCO GDP : 86.4 GDP Growth: 5.6% QATAR GDP : 102.3 GDP Growth: 16.4% UAE GDP : 260.1 GDP Growth: 7.4% SAUDI ARABIA GDP : 481.6 GDP Growth: 4.4% ALGERIA GDP : 159.7 GDP Growth: 3.0% EGYPT GDP : 162.2 GDP Growth: 7.2% OMAN GDP : 52.6 GDP Growth: 7.8% MENA REGION – ECONOMIC OVERVIEW ($B) MENA – Rising Economic Superpower
14% IMF Economic Outlook for the Middle Eastern Countries Qatar Libya Yemen Iraq Saudi Arabia Oman Egypt Nominal GDP Growth Rate (2009-14 E) Syria UAE Kuwait Bahrain Jordan Iran Lebanon Middle East – Economic Outlook • The long term prospects for growth are strong for the MENA region • MENA investment focusing on petrochemicals, metals, manufacturing • However, short term growth in these markets effected by the recession – current global surplus in these industries • Investors that are going forward willing to take risks in return for lower CAPEX USD 50 billion Inflation, 2009 (Annual % Change) Note: Bubble Size Represents the GDP in USD billion. Source: IMF and Frost & Sullivan
MENA Economic Trends The MENA economies will continue to witness a rapid growth, entailing a constant demand for Energy to fuel the growth Percentage Growth Year
Huge disparity The Per Capita Energy consumption disparity • Electricity demand increased over 8x in MENA last 3 decades • Overall energy demand expected to nearly double for the world, MENA by 2030 • MENA countries among highest per capita energy consumers in the world • Not following the developed nations growth plateau per capita energy consumption • Middle Eastern demand for energy being further fuelled by their drive to diversify: • Petrochemicals • Metals (especially Aluminium)
The Share of Renewables in the World Energy Mix Europe 2009: 6% Solar/Wind 2015: 15% Solar/Wind Asia 2009: 2% Solar/Wind 2015: 9% Solar/Wind North America 2009: 3% Solar/Wind 2015: 12% Solar/Wind MENA 2009: <1% Solar/Wind 28+ MW Solar 885 MW Wind 2015: ?% Solar/Wind
MENA/EU Wind Potential Source: MED EMIP/EU
Middle East Region Energy Mix - Set to Change? Emissions – Awareness and Regulations Nuclear Energy – Risky and not available to all Middle East Energy Mix: Renewables as the Solution? Higher propensity to export Oil & Gas Diminishing production from existing sources Reducing frequency for new discoveries
Global Perspective • North America • Green as a way to boost economy • Increased Fed involvement in sustainability • CEE • Growing “Western” lifestyle • Green influence from W. Europe • Growth as production centers • China • Manufacturing hub • R&D skill growth • QC issues persist • Reverse-engineeringcenter • W Europe • More mature green market • “20 by 2020” fuels growth • Corp. HQ for Green • MENA • Surging power needs • Environmental concerns • Geographically advantageous • Potential hotbed for nascent RE • Japan • Advanced Industry • Major solar players • Domestic focus • India • Advanced labor, low cost • EU Green investments flowing in • Global hub for low cost sourcing
Renewable Energy Adoption Global Drivers Differ from MENA Drivers Global Drivers for Renewable Energy adoption Government stimulus & mandates Job Creation Reduction of Energy interdependence Climate change regulations • However, this is being challenged in recent times: • The lowered price of Oil during the recession has led to a cutback in proposed investments in renewable energy • Funding for Renewable energy projects has seen a setback • CCS is being seen as a more feasible option by Energy majors – examples are BP and Shell, with both pulling out of a number of Renewable energy ventures • Potential oversupply of Gas in the short term will cause issues for Renewables
Tafarya Wind Farm– 300 MW Manjil Wind Farm 100 MW Bizerte Wind Farm– 120 MW Zafarana Wind Farm – 320 MW IRAN 250 MW Wind energy installations by 2010 MOROCCO - RE contributing 11% and 18% of total energy mix by 2011 and 2018 resp JORDAN – 600 MW Wind energy installation by 2020 TUNISIA - 300 MW wind energy installation by 2010 QATAR3.5 GW of solar power by 2013 Swicorp-CDC-Norson 12000 MT polysilicon plant ABU DHABI – RE to contribute 10% of total power gen capacity by 2020 ALGERIA - RE contributing 5% of total energy requirement by 2020 EGYPT - RE contributing 20% of total electricity generated by 2020 Masdar initiative KAUST 100 MW WIND FARMS SOLAR PV MANUFACTURING FACILITIES PLANNED INVESTMENTS SOLAR PROJECTS Up to $5 Mil $5 MI to $1Bil $1 Bil to $10 Bil Over $10Bil Existing Plants Represents RE mandates / goals / plans Existing Plants Existing Plants Major Projects Underway Major Projects Underway Major Projects Underway Major Projects Planned Major Projects Planned Major Projects Planned KEY RENEWABLE ENERGY PROJECTS & MANDATES IN MENA $500 Mil investment by QSTP for polysilicon plant
Future Trend analysis 2009 - 2020 High Impact Govt. mandates setting targets Increase in global demand for Gas, causing scarcity in the region Increase in Industrialization/ Manufacturing Increase in the price of electricity in the region Increase in Private funding for Renewables Projected Impact on the Renewables Industry CCS Implementations by O&G majors Deregulation/ Privatized power generation Private capital for Renewables flowing to other “high-potential” zones Desalination of sea water using CSP BIPV GCC grid not “smart” enough to handle Renewable load Lack of local expertise IRENA’s presence bringing about stricter emissions controls Nuclear power base increases Low Impact High Low Certainty of the Occurrence
Where does Renewable Energy stand today? Comparison of costs (MENA) by Generation Type • Solar energy still expensive • However, expected to reduce to <10c per kWh by 2020 • Economies of Scale matter: Wind as low as 5.4c/kWh in US w/out PTC • To help level playing field with subsidized rates on fossil fuels in oil exporting countries, renewable require government support Price per kWh Generation type
Installed Capacity Additions Total Installed Capacity Growth Meeting Growth with Renewables 16,800 MW 1736% Growth 1200 MW 1211% Growth 2009 Installed Cap: 200GW Solar/Wind: 900MW 2015 Installed Cap: 240GW 4800 MW 425% Growth 2% Solar/Wind 5% Solar/Wind 7% Solar/Wind
Fuel Supply And Costs Energy Demand & Efficiency Mandates Environment Issues Green Economy Gains CurrencyAnticipated Timeline for Major Industry Issues 2008-2010 2015 2020 2025 2030 Major Issue Cleantech Investments; Clean Energy Patents, Substitution with Renewables Resurgence of Nuclear Increased RPS Adoption Coal reaches Almost 45% of energy Consumption, following growth in India and China Growth of natural gas kept in check by high gas prices Price stabilizes for Renewables Continued scrutiny on acceleration of coal-fired power Energy demand dominated By India & China Developing economies pass 40% of electricity demand Building Efficiency Mandates; Smart Buildings Global Energy Demand almost double 2000 levels Green Ratings set to avert emissions Information Technology Plugs Into Green Regulators Take Class Actions Convergence of Smart Buildings, Smart Grid and Smart Cities Water Intensity Gains Scrutiny Green dominates Chain of Command Water Becomes the New Carbon Accelerated investment in carbon capture and storage China overtakes the US as the world’s biggest emitter of CO2 Global CO2 Emissions reach 40 Gt Carbon Becomes a Business Imperative Source: Frost & Sullivan
Sustainability – a Myriad of Options Technologies and Services Fuels & Feedstocks Alternative/ Renewables Emission Reduction Energy Efficiency Solutions Supply-side Demand-side End-of-pipe • Green buildings • Low energy appliances • Building control products • Smart meters & grids • Smart homes • Energy management • T&D infrastructure • Wind power • Solar • Biomass • Fuel cells • Energy Storage • Hydro • Wave, tidal, deep-lake • Geothermal • Advanced turbines • Air pollution control • Coal to gas • Filter technology • Clean coal • Carbon capture & storage • Clean fuels • Biofuels • Hydrogen • Biomass • Waste to Energy Energy Efficiency & Renewables • Air filtration • VOC control • Water & wastewater treatment • Waste management • Waste to energy • Water recycling • Energy recovery • Waste recycling • Desalination • Gasification • Anaerobic digestion • Biogas • Pyrolysis Environment & Clean-Tech • Bio solids • Bio wastes • Electric vehicles • Hybrid vehicles • Filters • Converters etc. • Power quality monitoring • Biodiesel • Ethanol • LPG • Dual fuel systems • District Heating & Cooling Urban Infrastructure & Transportation • Mass transportation • Vehicle efficiency technology • Fuel cell vehicles • Public Outdoor Lighting • Grid Monitoring
Investments across the Value chain Regulatory Mandates Manpower Training R & D to increase efficiency Cultural & Mindset Shifts Stricter Emissions norms Action Path “Towards Greener & Smarter”
Roberta Gamble, Director, Energy & Power Systems, N. America • Roberta Gamble is the Director for Frost & Sullivan’s North American Energy and Power Systems Practice. She works closely with major energy-related companies – including equipment manufacturers, service providers, and utilities – to guide the direction of the group. Through networking, industry conference and on-site client presentations, and by integrating Sales and other Frost & Sullivan groups, Gamble directs energy research, focuses content on the pressing energy issues of the day, and ensures that Frost & Sullivan subscriptions are valuable and relevant to each client. She also manages consulting projects and customized client research. • Since joining Frost & Sullivan in January 2000, Gamble has also been the lead analyst and project manager for numerous projects. Her major areas of research have been: • Distributed generation – engine generator sets, gas turbines, solar power, fuel cell • Central generation – gas and steam turbine equipment and power plant services, renewable power • Energy management services • Gamble has received acclaim for her research and has been interviewed by a number of publications, including The Chicago Tribune and the New York Times, and has appeared on National Public Radio’s “Living on Earth.” Roberta Gamble Director Energy & Power Systems North America Bachelor of Arts in Economics; International Relations