Download
1 / 27
270 likes | 274 Views
This research report examines the performance on science, maths, and reading domains in the PISA 2006 survey. It explores the factors associated with performance, attitudes to science, and provides an overview of the main achievement outcomes.

E N D
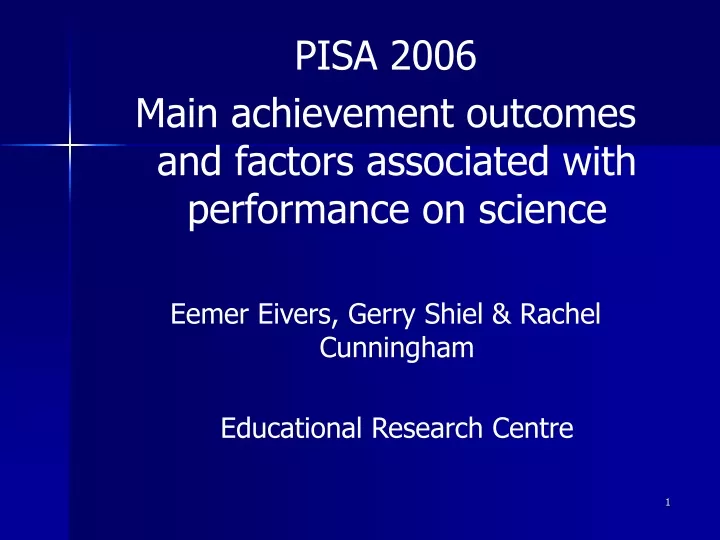
PISA 2006 Main achievement outcomes and factors associated with performance on science Eemer Eivers, Gerry Shiel & Rachel Cunningham Educational Research Centre
Main Topics • Background • Scientific literacy as defined by PISA • Performance on science (major domain) • Performance on maths and reading (minor domains) • Trends in IRL and OECD • Factors related to performance • Attitudes to and engagement in science • Explaining performance
Background: What is PISA? • An OECD project • Takes place in 3-year cycles(2000 – 2003 – 2006 – 2009 – 2012 – 2015 …..) • Assesses 1 major and 2 minor ‘domains’ • Science, reading & maths • Examines ‘literacy’ - applying knowledge, not just reproducing facts studied in a curriculum
Background: What is PISA? • Information collected • 2-hour test • Questionnaires: students, principals & science teachers • Who participated in 2006? • All OECD countries, & 27 ‘partner’ countries • Target group: 15-year-olds • 400,000 students (probably the world’s largest survey) Ireland: 165 schools and 4,585 students
Framework Items & Topics Overall Scale (mean 500, SD 100) Subscales Subscales Subscales
Science Framework Context Situations involving science / technology • Attitudes • Interest in science • Support for scientific enquiry • Responsibility towards resources • Competencies • Identify scientific issues • Explain phenomena scientifically • Use scientific evidence • Knowledge of • living systems • physical systems • Earth and space systems • technology systems • Knowledge about science
Overall Science Performance:Reading the table • Countries vs. OECD average Green = sig. above OECD Amber = not sig. different Red = sig. below OECD • Countries vs. Ireland ▲ = sig. above IRL O = not sig. different ▼ = sig. below IRL **only top 40 countries shown
Proficiency Levels • Convert continuous scale into skill levels • 6 Levels for science • PL 6 is the highest • Need to reach PL 2 to show ‘baseline’ scientific competency
What can they do at PL 6 or PL 1? • Level 1 • often confuse key features of an investigation, apply incorrect scientific information, and mix personal beliefs with scientific facts in support of a decision. • Level 6 • consistently identify, explain and apply scientific knowledge of and about sciencein a variety of situations. • link different information sources and explanations and use evidence from those sources to justify decisions.
What are the items like? • PISA uses test units • A group of items around a common ‘stimulus’ (text and/or graphic) • Allows more real-world context • Sample item handout in delegate pack • 3 science units, 1 reading and 1 maths • Attitudes items shown for science
So far …. • How does PISA define science? • How did we do? • What does the test look like? Next • How does it compare to JC science?
Linking PISA & Curriculum • Test-curriculum comparison a feature of Irish PISA analyses • (see: Shiel et al., 2001; Cosgrove et al., 2005) • Reasonable correlations between rated ‘familiarity’ of concepts and performance on reading and maths • r ranges from .3 to .5 • For science, familiarity:performance link is weaker • r is around .1
Matching PISA items to the JC Science Syllabus * Versus 43% of items in PISA 2000
Knowledge of Science • How successful is the revised syllabus in providing coverage of the three core areas (Biology, physics and chemistry)? • What are the JC ‘equivalents’ of PISA knowledge areas? • Living systems / biology • Physical systems / physics & chemistry • Earth & space / ?? parts of geography?
Scores on ‘knowledge’ scales Red= significantly higher than OECD
Science Competencies Red= significantly higher than OECD
Science Performance: Overview • IRL just above the OECD average • Strength: identifying scientific issues • Gender differences on some subscales • Fewer low-achieving students, and about average % of high achievers • No ‘weak’ areas nationally, but females weak on physical systems • The link between familiarity and performance is weaker for science than for reading and maths