Download
1 / 39
390 likes | 518 Views
Data Walls and Efficacy. Pierce Lamberson. This is my second year at West Jefferson I teach Algebra I in the 9 th grade academy I’m not an education school professor! I did have success with data tracking last year. Objectives. Teachers will set a quantitative end-of-year test goal.

E N D
Pierce Lamberson • This is my second year at West Jefferson • I teach Algebra I in the 9th grade academy • I’m not an education school professor! • I did have success with data tracking last year
Objectives • Teachers will set a quantitative end-of-year test goal. • Teachers will understand how to track progress towards that goal. • Teachers will have an idea of how they will display their data in their classroom.
The Bad News • We need to make dramatic, seemingly impossible growth in order to make West Jefferson a school that adequately serves our students. • It’s a daunting task!
The Good News • All of you are great instructors. • I’ve witnessed it in classrooms across the school. • You know how to work with kids and I have a lot to learn from you. • Data tracking is REALLY easy!
We need to set up a system that will translate all of the instructional talent in this room into student growth.
How are we going to make dramatic growth happen? 1) Set an ambitious goal. 2) Tracking: Monitor our progress toward that goal. 3) Reflect and be persistent.
1) Setting a Quantitative Goal • Like it or not, we are going to be measured by our test scores. • On Tuesday you set a qualitative vision for your classroom. • Now let’s attach that to a number.
Intersection of Ambition and Feasibility • You want to set a score goal for your students that defies expectations. • Examine the data on your respective EOC or GEE test and decide where you would like to see your students score.
An Example: My Goal • My students will pass the Algebra I EOC with an average score of 725 739- 800 700-738 668-699 600-667
Geometry #%#%#%#%# Needs Improvement Total Fair Excellent Good WJ 12 4 43 14 86 28 162 53 303 PFT 24 92 2 8 0 0 0 0 26 TJ 52 48 46 42 10 9 1 1 109
English II #%#%#%#%# Needs Improvement Total Fair Excellent Good WJ 7 3 70 26 84 31 109 40 270 PFT 19 68 8 29 1 4 0 0 28 TJ 54 50 51 48 2 2 0 0 107
GEE ELA A M B AB U WJ 0 4 36 31 29 PFT 4 60 36 0 0 TJ 10 33 53 4 0
GEE Math A M B AB U WJ 0 4 36 31 29 PFT 4 60 36 0 0 TJ 10 33 53 4 0
Set a Goal • Jot down the average that you would like your students to achieve this year on their end-of-year test. • Remember to set it at the intersection of ambition and feasibility! • DON’T FORGET THIS NUMBER!!!
Easy Right? • Now we just have to hold ourselves accountable to it. • We do this through data tracking and reflection.
2) Tracking: Monitor Progress We have to know our status • Create rigorous assessments that align to your GLEs and end-of-year tests • Track tests by GLE • Display results
Be Honest with Yourself: Your Data has to be Good Data • Pull your assessment items from sources that are at least as rigorous as your end of course test. • Eagle and The Learning Institute are great. Other states’ items: Massachusetts • Like it or not, this is the level your students will be tested at.
Track Tests by GLE! • Find a way to break your assessments into GLEs. • You need to know how many questions a student correctly answered on each GLE. • Then simply enter this information into a spreadsheet or gradebook.
Get mastery down to a Percent • De’Vante answered 3 out of 5 questions right on GLE 8. He mastered GLE 8 at 60%, needs some improvement. • Jerry correctly answered 9 out of 10 questions on GLE 10. He mastered GLE 10 at 90%, he’s on track on that skill.
Example • I do this by simply creating an answer sheet that is broken into GLEs. Students transfer their answers and when I grade I can instantly see their mastery. • I then enter it into an Excel sheet. • word doc - test • excel sheet
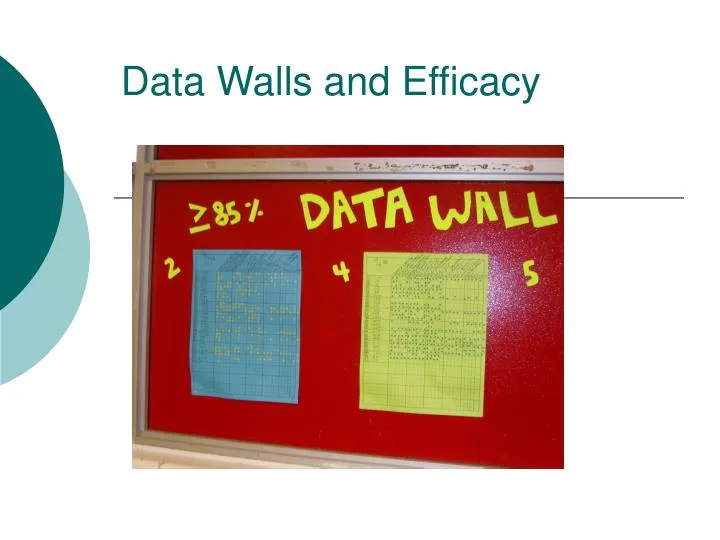
Display Your Results as a Constant Reminder • Or better yet, have students display the results! • You want something that has a presence in your classroom and will be a constant reminder of your task and of your progress. • This is where the data walls come in, finally.
At any given point in the year, you should know exactly where your students stand on the GLEs you’ve covered.
Data Walls • Keep it simple! • Don’t be afraid to be creative!
3) Reflect and Be Persistent • Data allows reflection and pushes progress. It puts you face to face with your challenges. “…cognitive psychologists Carl Bereiter and Marlene Scardamalia set out to identify what differentiated the “experts” in a wide variety of fields from those who were widely regarded as merely strong performers. They anticipated that they would discover the experts were more motivated, or perhaps more intelligent, or perhaps more dedicated to their craft. Yet across a wide variety of sectors—from silver-smithing to law, surgery to architecture—they discovered that one trait differentiated experts from the rest. The experts were more likely to be self-critically focused on improving their skills.”
Reflect and Be Persistent • Once you know the mastery levels of your students, you can start problem solving weaknesses and you can celebrate strengths. • Try out different groupings! Differentiate! • Reflect, re-teach, and re-test • Work hard towards that quantitative goal.
Reflect and Be Persistent- 3 Keys to Problem Solving • Rely on good data • Make logical connections between where your students are, why it’s happening, and what you’re going to do about it. • Prioritize the most important things
Reflect and Be Persistent • This is the hard part. • But as exceptional instructional leaders, this is the part that is most natural to you. • You know how to work with students!
Bottom Line • Tracking is incredibly easy and there is no reason why you can’t track the progress of your students. • Doing so will clarify your challenges and put your instructional skills to work.
Exit Slip 1) What is your quantitative end-of-course goal? 2) Where are you going to get rigorous, test-aligned assessment items from? 3) How are you going to display your data? (what type of data wall? Chart, illustration, mural, ect.) 4) Name two ways in which tracking data will improve your instruction.
Have an awesome school year! • Feel free to come to me with any questions. Pierce.Lamberson… (540) 273 9028 Room 222