Download
1 / 17
180 likes | 218 Views
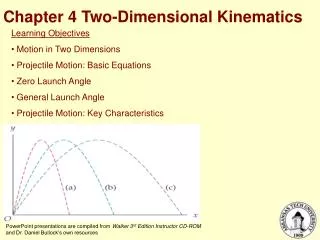
Chapter 4 Two-Dimensional Plots. CHAPTER 4. Outline. Introduction The plot Command The fplot Command Plotting Multiple Graphs In The Same Plot: Using the plot Command Using the hold on and hold off Commands

E N D
Chapter 4 Two-Dimensional Plots
CHAPTER 4 Outline • Introduction • The plot Command • The fplot Command • Plotting Multiple Graphs In The Same Plot: • Using the plot Command • Using the hold on and hold off Commands • Plotting Multiple Plots In The Same Figure By Using The subplot Command • Formatting a Plot Matlab Lab
CHAPTER 4 Introduction • Plots are a very useful tool for presenting information. • MATLAB has many commands that can be used for creating different types of plots. • In this chapter we will describe how MATLAB can be used to create and format many types of two-dimensional plots. Matlab Lab
CHAPTER 4 4.1 THE plot COMMAND • The plot command is used to create two-dimensional plots. • The arguments x and y are each a vector (one-dimensional array). • The two vectors must have the same number of elements. • When the plot command is executed, a figure is created in the Figure Window. Matlab Lab
CHAPTER 4 4.1 THE plot COMMAND Matlab Lab
CHAPTER 4 4.1 THE plot COMMAND Matlab Lab
CHAPTER 4 4.1 THE plot COMMAND Line Specifiers: Matlab Lab
CHAPTER 4 4.1 THE plot COMMAND Notes about using the specifiers: • The specifiers are typed inside the plot command as strings. • Within the string the specifiers can be typed in any order. • The specifiers are optional. This means that none, one, two, or all three types can be included in a command. Matlab Lab
CHAPTER 4 4.2 THE fplot COMMAND The fplot command plots a function with the form y=f(x)between specified limits. function: The function can be typed directly as a string inside the command and can be typed as a function of any letter. Example: 8*x^2+5*cos(x) limits: The limits argument is a vector with two elements that specify the domain of x [xmin,xmax], or a vector with four elements that specifies the domain of x and the limits of the y-axis [xmin,xmax,ymin,ymax]. line specifiers: The line specifiers are the same as in the plot command. Matlab Lab
CHAPTER 4 4.2 THE fplot COMMAND Matlab Lab
CHAPTER 4 4.3 PLOTTING MULTIPLE GRAPHS IN THE SAME PLOT 4.3.1 Using the plot Command Two or more graphs can be created in the same plot by typing pairs of vectors inside the plot command. Matlab Lab
CHAPTER 4 4.3 PLOTTING MULTIPLE GRAPHS IN THE SAME PLOT 4.3.1 Using the plot Command Matlab Lab
CHAPTER 4 4.3 PLOTTING MULTIPLE GRAPHS IN THE SAME PLOT 4.3.2 Using the hold on and hold off Commands • To plot several graphs using the hold on and hold off commands, one graph is plotted first with the plot command. • Then the hold on command is typed. This keeps the Figure Window with the first plot open, including the axis properties and formatting if any was done. • Additional graphs can be added with plot commands that are typed next. • The hold off command stops this process. Matlab Lab
CHAPTER 4 4.3 PLOTTING MULTIPLE GRAPHS IN THE SAME PLOT 4.3.2 Using the hold on and hold off Commands • To plot several graphs using the hold on and hold off commands, one graph is plotted first with the plot command. • Then the hold on command is typed. This keeps the Figure Window with the first plot open, including the axis properties and formatting if any was done. • Additional graphs can be added with plot commands that are typed next. • The hold off command stops this process. Matlab Lab
CHAPTER 4 4.4 PLOTTING MULTIPLE Plots IN THE SAME Figure by Using the subplot Command • It can sometimes be useful to display multiple plots on the same figure for comparison. • This can be done using the subplot function, that takes arguments for number of rows of plots, number of columns of plots, and plot number currently being plotted: • subplot (nrows,ncols,plot_number) Matlab Lab
CHAPTER 4 4.4 PLOTTING MULTIPLE Plots IN THE SAME Figure by Using the subplot Command Example: Matlab Lab
CHAPTER 4 4.5 FORMATTING A PLOT Formatting a Plot Using Commands Matlab Lab