Download
1 / 23
230 likes | 388 Views
Quantitative Methods Final Project. Part I: El Nino and Speleothems Part II: Directional Data Analysis of Lineaments in Tucker County, West Virginia. Laura Burnette. Part I: El Nino and Speleothems. Speleothems as paleoclimate indicators. Data.

E N D
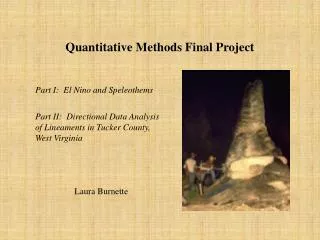
Quantitative Methods Final Project Part I: El Nino and Speleothems Part II: Directional Data Analysis of Lineaments in Tucker County, West Virginia Laura Burnette
Part I: El Nino and Speleothems Speleothems as paleoclimate indicators
Data • Carbon isotope data from Actun Tunichil Muknal cave in Belize collected by Frappier, et al. (2002) • 2. Calculated monthly Southern Oscillation Index data • 3. Reconstructed Annual Southern Oscillation Index data 4. Speleothem data - collected by Polyak and Asmerom (2001) - represents annual band data for stalagmite BC2, Bat Cave passage of Carlsbad Cavern, Carlsbad Caverns National Park, New Mexico
Fourier Analysis of Monthly Calculated SOI Frequency (cycles/month) Period (years) 0.0056 14.9 0.018 4.6 0.023 3.6 0.035 2.4 0.041 2 0.055 1.5 0.11 0.76 (9.1 months)
Fourier Analysis of Annual Reconstructed SOI Frequency (cycles/year) Period (years) 0.175 5.7 0.24 4.2 0.28 3.6
Fourier Analysis of Carbon Isotope Data Frequency (cycles/year) Period (years) 0.065 15.4 0.19 5.3 0.28 3.6 0.46 2.2
Fourier Analysis of Speleothem Band Thickness Data Frequency (cycles/year) Period (years) 0.0038 263 0.013 77 0.024 42 0.038 26 0.065 15 0.17 5.9 0.18 5.6 0.41 2.4
Shared Periodic Components Belize carbon isotope data 15 5.3 3.6 2.2 Calculated monthly SOI (1973-2001) 14.9 4.6 3.4 2.4 2 1.5 0.76 Reconstructed annual SOI (1706-1977) 5.7 4.2 3.6 Carlsbad speleothem band thickness 263 77 42 46 14 5.9 5.6 2.4 Dataset Periods (in years)
Part II: Directional Data Analysis of Lineaments in Tucker County, West Virginia
Distance From Lineament Number of Cave Entrances Percentage of Cave Entrances 0 to 50 meters 72 51.1 50 to 100 meters 25 17.7 100 to 150 meters 13 9.2 150 to 200 meters 7 5.0 200 to 250 meters 2 1.4 250 to 300 meters 3 2.1 300 to 350 meters 2 1.4 over 350 meters 1 0.7 Number of cave entrances within specified distance from the nearest lineament
Statistics for Directional Data • Rose diagrams may be misleading • Tests for randomness • Tests for equality of two samples • Assumption: Von Mises distributions • Non-parametric test for equality of two samples: Uniform scores test
Finding the azimuths of the lineaments Step 1: ArcINFO UNGENERATE command Step 2: Trigonometry Landsat lineaments
Lineaments digitized from Landsat and PCA Figure 12: Rose diagram of the orientations of lineaments digitized from Landsat image of Tucker County. Figure 13: Rose diagram showing orientation of lineaments digitized from PCA image of Tucker County.
Lineaments digitized from hillshades Figure 15: Rose diagram showing orientation of lineaments digitized from hillshade of the Mozark Mountain quadrangle with a sun azimuth of 225 degrees. Figure 16: Rose diagram showing orientations of lineaments digitized from hillshade of the Mozark Mountain quadrangle with a sun azimuth of 315 degrees.
Test for Randomness Landsat lineaments
Results of the test for Randomness • At an alpha level of .05, • Landsat lineaments are not random • PCA lineaments are random • Both sets of hillshade lineaments are not random Figure 13: Rose diagram showing orientation of lineaments digitized from PCA image of Tucker County.
Results of Uniform Scores Test • The Landsat lineaments and PCA lineaments are statistically different. • The two sets of hillshade lineaments are statistically different. PCA Landsat Sun azimuth 225 Sun azimuth 315
References Allan, R.J., J. Lindesay and D. Parker. 1996. El Nino/Southern Oscillation & Climatic Variability. CSIRO Publishing. 408 pp. Allan, R.J., Nicholls, N., Jones, P.D. and Butterworth, I.J., 1991: A further extension of the Tahiti-Darwin SOI, early SOI results and Darwin pressure. J. Climate 4, 743-749. Cook, E.R. 1985. A Time Series Approach to Tree Ring Standardization. PhD dissertation. Tucson, AZ: U. of Arizona. 171 p. University Microfilms International, 300 N. Zeeb Rd, Ann Arbor, MI 48106 Davis, J.C., 2002. Statistics and Data Analysis in Geology, John Wiley & Sons, New York, New York. Frappier, A., D. Sahagian, L.A. Gonzalez, and S.J. Carpenter, 2002, El Nino Events Recorded by Stalagmite Carbon Isotopes, Science 298 (5593), pp.565, 18 October 2002. Können, G.P., Jones, P.D., Kaltofen, M.H. and Allan, R.J., 1998. Pre-1866 extensions of the Southern Oscillation Index using early Indonesian and Tahitian meteorological readings. J. Climate 11, 2325-2339. Lattman, L., 1958. Technique of mapping geologic fracture traces and lineaments on aerial photographs, Photogrammetric Engineering, 24(4): 569-576. Mardia, K.V., 2000. Directional Statistics. John Wiley & Sons, Chichester, West Sussex, England. NOAA/National Weather Service, The El Nino/La Nina Cycle (Tutorial), National Weather Service Climate Prediction Center, www.nws.noaa.gov. Polyak, V.J. and Asmerom, Y. 2001 Late Holocene Climate and Cultural Changes in the Southwestern United States, Science 294: 148-151. Ropelewski, C.F. and Jones, P.D., 1987: An extension of the Tahiti-Darwin Southern Oscillation Index. Monthly Weather Review 115, 2161-2165. Stahle, D.W., R.D. D'Arrigo, P.J. Krusic, M.K. Cleaveland, E.R. Cook, R.J. Allan, J.E. Cole, R.B. Dunbar, M.D. Therrell, D.A. Gay, M.D. Moore, M.A. Stokes, B.T. Burns, J. Villanueva-Diaz and L.G. Thompson. 1998. Experimental dendroclimatic reconstruction of the Southern Oscillation. Bull. American Meteorological Society 79: 2137-2152. White, W., 1988. Geomorphology and Hydrology of Karst Terrains. Oxford University Press, New York, NY. WVASS, unpublished. Caves and Karst of Tucker County, West Virginia.