Download
1 / 49
490 likes | 632 Views
A hybrid modeling framework for intensively managed Douglas-fir in the Pacific Northwest. Aaron Weiskittel Department of Forest Science. Hypotheses. Empirical models struggle to predict growth response to intensive management because:

E N D
A hybrid modeling framework for intensively managed Douglas-fir in the Pacific Northwest Aaron Weiskittel Department of Forest Science
Hypotheses Empirical models struggle to predict growth response to intensive management because: The selected time step can not capture the highly dynamic nature of growth following management Dynamics of the crown are inadequately represented Influence of site physiographic features (aspect, slope, elevation), soils (depth, texture, % rock), or climate are not included in the projections
Justification/Objectives • All possible combinations of treatments cannot be field tested • Better understanding of physiological mechanisms: • improve extrapolations to untested combinations • explain some of the differences in behavior among data sets and resulting models • objective is to build a model that represents key ecophysiological processes in a practical yet mechanistic manner • responses to a wide array of silvicultural treatments and regimes can be tested • sensitivity to weather and treatment interactions with weather
Annualized diameter and height growth equations for Douglas-fir, western hemlock, and red alder in the Pacific Northwest, USA In Press: Forest Ecology and Management
Introduction Most regional individual tree growth & yield models operate on a 5-10 year time step Commonly assumed that increasing temporal resolution of the model would decrease overall precision Annual fluctuations in weather are averaged out Plot remeasurement data are typically collected on a 2-10 year interval, which makes getting annual growth difficult and imprecise
Objectives/Justification Use the iterative method of Cao (2002; CJFR 32: 2051-2059) to estimate annualized growth equations Diameter and height fitted with maximum likelihood and multi-level mixed-effects random effects correlated with installation physiographic features 3 plantation species in western OR and WA Douglas-fir western hemlock red alder
Methods Only control (untreated) plots used Hann et al. (2003; OSU FRL Res. Contrib. 40) model forms used Site indices were: DF, Bruce (1981; For Sci 4: 711-725) WH, Bonner et al. (1995; Can. For. Serv. Info Report BC-X-353) RA, Nigh & Courtin (1998; New Forest 16: 59-70)
Methods: Model fitting technique Requires no modification of the growth data (i.e. no interpolation to a common remeasurement length) Constrains predicted periodic growth, which reduces the error associated with annually updating a tree list Basically, a simple do loop combined with a minimization function
Results Models fit well (R2 ~ 0.5 – 0.9) and were consistent with biological expectations Multi-level mixed effects (MLME) indicated significant installation and plot variation MLME significantly improved model fits Diameter growth peaked at 30, 25, and 15 cm DBH for DF, WH, and RA Hann et al. (2003) height growth equation worked well for DF, but modifications are required for WH and RA
Results Installation random effects provided a few interesting relationships for DF and RA, but fits were generally poor (R2 < 0.35) Physiographic variables better predictors than soils or mean climate variables WH showed no relationship with any examined variable
Simulation 12 SMC Type II installations (not used in fitting) used for model verification Initial BH age: 23.5 – 46.5 Site index: 29.3 – 48.0 m Growth simulated for 12 – 16 years using the annualized growth equations combined with previously fitted annual mortality function and a static crown recession model Predictions compared with SMC-variant of ORGANON v8 Distance-independent, individual tree with 5 year time step
Results: Simulation After 12-16 years of simulation, annualized equations were better than ORGANON predictions Multi-level mixed effects (MLME) models performed better than maximum likelihood (ML)
Conclusion Annualized equations offer an opportunity to improve the precision of growth projections, while providing several additional benefits: Not restricted to a preconceived time interval Biologically justified Improved chance of capturing the growth dynamics following intensive management Opportunity to connect empirical equations with a process-based model Process-based model is needed to capture the influence of climate, soils, and physiographic features
In Review: Canadian Journal of Forest Research Modeling the influence of intensive management on Douglas-fir individual branch growth and mortality: implications for predicting tree growth response
Introduction • Crowns are an important link between physiological processes and observed growth response • Few growth and yield models represent crowns in a significant amount of detail • E.g., most use static height to crown base equations to predict crown recession • Capturing the dynamics of crown may be an important step for improving individual tree growth projections
Introduction previous branch work in Douglas-fir is limited Maguire et al. (1994) tree age was young (4-7 yrs at breast height) Maguire et al. (1999) only live branches Turnblom and Briggs (1999) branches at breast height only branch-level models exists for several other important commercial species (NZ, FIN, FRA) few have considered the effects of intensive management
Objectives Monitor the growth and mortality of individual branches on a multitude of stems across a range of stand type Understand branch dynamics following silvicultural treatments Develop models the predict branch dynamics using key variables Integrate these equations into an individual tree modeling framework
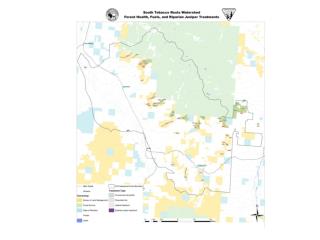
measure branch location and size in several different PNW installations SMC control fertilization (1-4 yrs after) thinning fertilization + thinning VMRC control 1.5, 3.3, & 9.3 m2of complete veg control complete control of woody veg only complete control of herb veg only PCT 254 stems/ha 508 stems/ha control SNC various levels of Swiss needle cast disease methods
Methods Branches on the trees used in a previous analysis were tagged and remeasured 2 years after initial measurement Treatment effects were assessed with multi-level mixed effects models with weighting and a correlation structure Final models were annualized using the technique previously discussed Total of 2,828 branches on 103 trees were remeasured
Simulation model • Final branch equations were combined with individual tree annualized growth models and the crown reconstruction algorithm • 4-yr growth on 56 plots with varying levels of silvicultural treatments was simulated • Control, Thin, Fertilized, & Thin + Fertilized • Compared to the use of a static height to crown base equation
Results: Branch growth • Significantly influenced by: • Precommercial thinning • Swiss needle cast disease • Commercial thinning • Fertilization • In the case of commercial thinning and fertilization, response varied by time since treatment • Overall, branch growth was related to branch size and location as well as tree diameter growth and crown size • Variability in the original data high (R2~ 0.25)
Results: Branch mortality • Significant treatment effect of: • Swiss needle cast • Commercial thinning • Fertilization • Vegetation management • With respect to commercial thinning and fertilization, effects dependent on time since treatment • Final model included initial branch size and location, summation of branch diameters above subject branch, tree size, and relative stand density • Mortality at the branch-level much better predictor than at the tree-level (i.e. R2~ 0.47)
Results: Simulation Predictions of height to crown base improved Mean bias of diameter and height growth reduced, but mean square error (MSE) not improved
Conclusions • Branch diameter growth and mortality were highly dynamic processes • Mortality was more predictable than growth • Growth peaked early (~6 mm in diameter) and was relatively nonexistent for the majority of a branch’s life • Branch dynamics were sensitive to stand conditions imposed by intensive forest management practices, but predictable • Improved representation of crown dynamics in an individual tree growth model slightly improved growth predictions
In Review: Ecological Modelling Development of a hybrid modeling framework for predicting intensively managed Douglas-fir growth at multiple levels
Introduction • High variability of climatic and soil conditions in the Pacific Northwest • Proximity to Pacific Ocean + 2 mountain ranges with different geologic histories = tremendous variation • Steep, broken terrain • Warm, dry Mediterranean climate makes water the driving variable • Site index is a crude measure of site productivity and relies on information from the current stand to make predictions • Indexes only height growth potential
Process Modeling Philosophy Keep the model simple yet mechanistically sound Derive parameters from literature and/or available data Flexible enough to accommodate a variety of approaches i.e. integrate key processes and improve with increased data No “free” parameters All required input must have an empirical basis
Literature Review Indication that the ‘best’ process-based models were those with: A daily time step and multiple time periods during each day Both direct and diffuse radiation considered A separation of canopy into sunlit/shaded leaf area Soil water and nutrient status connected to physiological processes
Development of the model Four basic modeling challenges: Simulate LAI from a tree list and basic stand info Mechanistically represent key physiological processes Estimate stand-level allocation of net primary production (NPP) to several biomass pools (foliage, stem, etc.) Predict individual tree dimensional growth and mortality
Development of the model a. prediction of LAI Several different approaches for estimating LAI were compared BHSAP, constant leaf area per unit of sapwood area at breast height CBSAP, constant leaf area per unit of sapwood area at crown base Gholz et al. (1979) allometric equation BCACS, simulates size, #, and leaf area of branches Actual LAI was not available Correlated with stand current annual increment
Development of the model a. prediction of LAI All simulated LAIs were significantly correlated with observed current annual increment (CAI) CBSAP (r = 0.81) Gholz (r = 0.79) BHSAP (r = 0.78) BCACS (r = 0.75) Correlations all relatively high, but their order can be deceiving
Development of the model b. prediction of current annual increment Model was applied to 56 plots, with the following treatments: Control Fertilized Thinned Thinned + Fertilized Wide range of growing conditions Both nitrogen responsive and non-responsive locations
Development of the model b. prediction of current annual increment 37
Development of the model b. prediction of current annual increment
Development of the model b. prediction of current annual increment
Development of the model b. prediction of current annual increment
Development of the model b. prediction of current annual increment Performance on Swiss Needle Cast Cooperative plots
Development of the model 3-PG’s approach to respiration and carbon allocation were more correlated with observed growth than several other methods These are important assumptions that require more examination and refinement Treatment of soil water effects on canopy photosynthesis was the primary source of improvement Bias of stand CAI projection comparable to a stand-level empirical model
Results: Individual tree growth Disaggregation of stand-level growth to individual tree proved quite difficult Best approach was based on weighted leaf area Mechanistic models of tree diameter and height growth achieved a level of biases comparable, but not better than purely empirical equations Solution was to modify empirical models based on annual NPP Tree mortality predicted using growth efficiency performed as well as an empirical model
Conclusions Reconstructing the crown provides good predictions of LAI across a range of stand conditions LIDAR offers the opportunity to prove initial LAI estimates, but does not eliminate the need for detailed crown dynamics Process-based models were a useful tool for integrating the effects of physiographic features and climate on tree growth Considerable error can be experienced with the primary physiological processes are not accounted for properly Understanding individual tree physiological processes is key for future progress
Overall conclusions Empirical growth and yield models continue to need refinement Annual time step and better representation of crown dynamics improved performance Hybridization of process-based with an empirical model can be a useful tool for both research and applied use Research into crown structure and dynamics provides insights into many key system attributes
Acknowledgements • Thanks to: • Committee members • Doug Maguire, Robert A. Monserud, Barbara Lachenbruch, Randy Johnson, Temesgen Hailemariam, Glenn Murphy, Paul Adams • Greg Johnson • Field and lab crew members (~30 temps over 5 yrs) • USDA Forest Service PNW Research Station
Dissertation and R library available online:www.holoros.com/DF.HGS.htm