Download
1 / 6
60 likes | 69 Views
Progress towards the elimination of iodine deficiency disorders via salt iodization programmes has been used for over 60 years. The aim of this study was evaluating the quantity and access of iodized salt used at household level and available at headquarters markets.

E N D
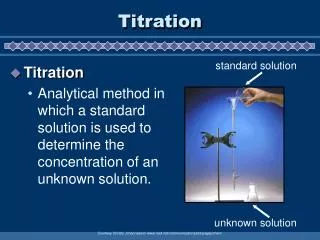
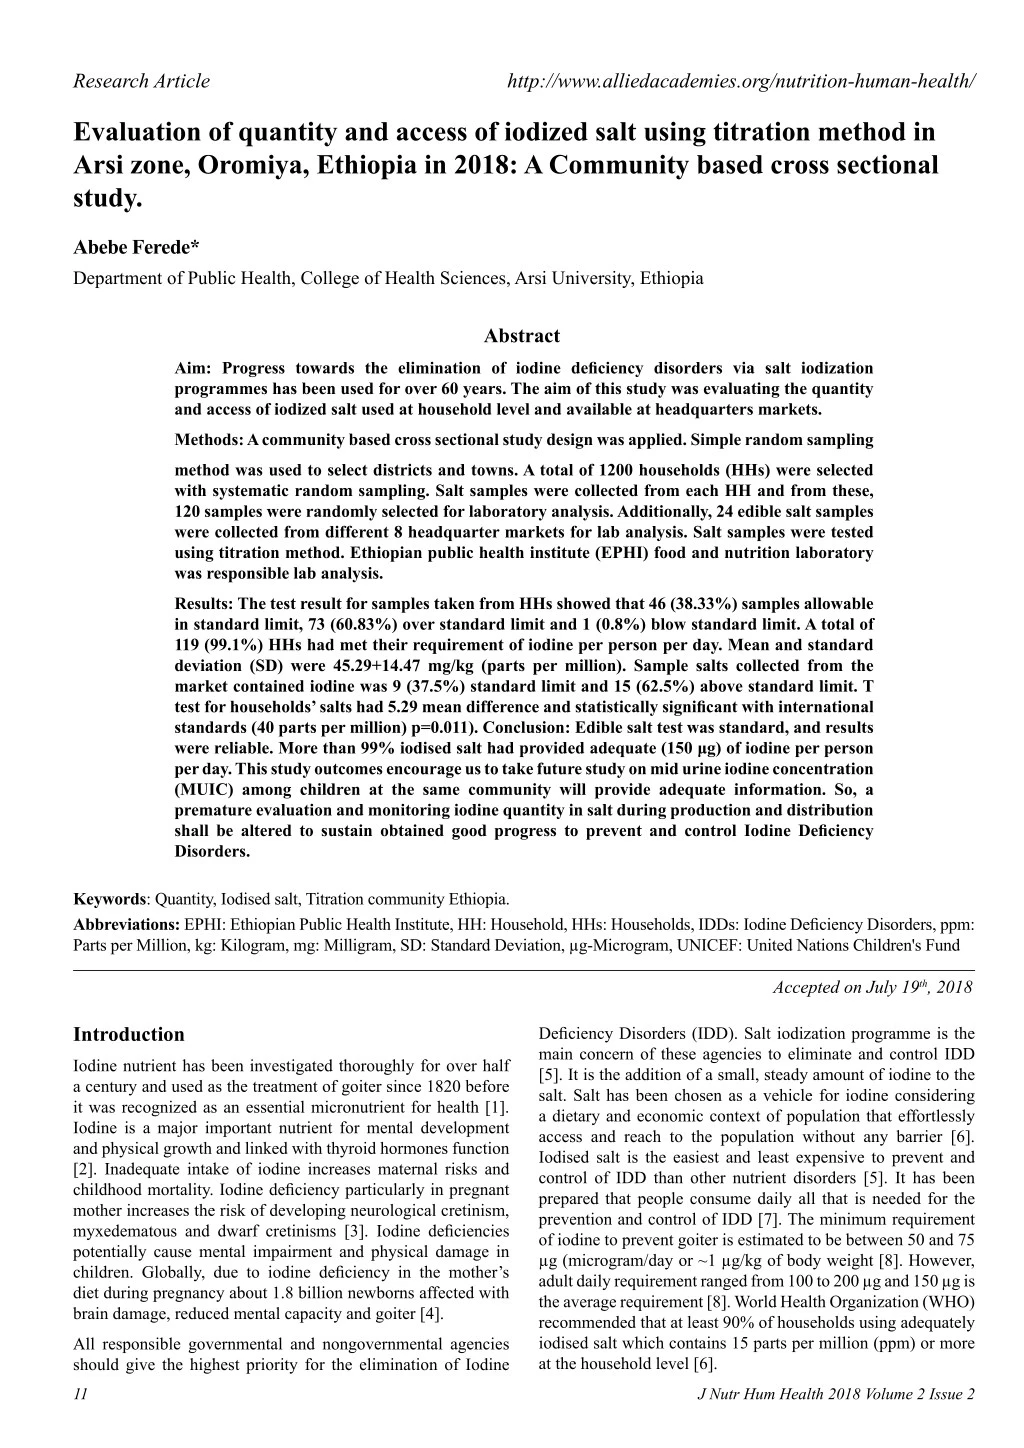
Research Article http://www.alliedacademies.org/nutrition-human-health/ Evaluation of quantity and access of iodized salt using titration method in Arsi zone, Oromiya, Ethiopia in 2018: A Community based cross sectional study. Abebe Ferede* Department of Public Health, College of Health Sciences, Arsi University, Ethiopia Abstract Aim: Progress towards the elimination of iodine deficiency disorders via salt iodization programmes has been used for over 60 years. The aim of this study was evaluating the quantity and access of iodized salt used at household level and available at headquarters markets. Methods: A community based cross sectional study design was applied. Simple random sampling method was used to select districts and towns. A total of 1200 households (HHs) were selected with systematic random sampling. Salt samples were collected from each HH and from these, 120 samples were randomly selected for laboratory analysis. Additionally, 24 edible salt samples were collected from different 8 headquarter markets for lab analysis. Salt samples were tested using titration method. Ethiopian public health institute (EPHI) food and nutrition laboratory was responsible lab analysis. Results: The test result for samples taken from HHs showed that 46 (38.33%) samples allowable in standard limit, 73 (60.83%) over standard limit and 1 (0.8%) blow standard limit. A total of 119 (99.1%) HHs had met their requirement of iodine per person per day. Mean and standard deviation (SD) were 45.29+14.47 mg/kg (parts per million). Sample salts collected from the market contained iodine was 9 (37.5%) standard limit and 15 (62.5%) above standard limit. T test for households’ salts had 5.29 mean difference and statistically significant with international standards (40 parts per million) p=0.011). Conclusion: Edible salt test was standard, and results were reliable. More than 99% iodised salt had provided adequate (150 μg) of iodine per person per day. This study outcomes encourage us to take future study on mid urine iodine concentration (MUIC) among children at the same community will provide adequate information. So, a premature evaluation and monitoring iodine quantity in salt during production and distribution shall be altered to sustain obtained good progress to prevent and control Iodine Deficiency Disorders. Keywords: Quantity, Iodised salt, Titration community Ethiopia. Abbreviations: EPHI: Ethiopian Public Health Institute, HH: Household, HHs: Households, IDDs: Iodine Deficiency Disorders, ppm: Parts per Million, kg: Kilogram, mg: Milligram, SD: Standard Deviation, µg-Microgram, UNICEF: United Nations Children's Fund Accepted on July 19th, 2018 Introduction Deficiency Disorders (IDD). Salt iodization programme is the main concern of these agencies to eliminate and control IDD [5]. It is the addition of a small, steady amount of iodine to the salt. Salt has been chosen as a vehicle for iodine considering a dietary and economic context of population that effortlessly access and reach to the population without any barrier [6]. Iodised salt is the easiest and least expensive to prevent and control of IDD than other nutrient disorders [5]. It has been prepared that people consume daily all that is needed for the prevention and control of IDD [7]. The minimum requirement of iodine to prevent goiter is estimated to be between 50 and 75 µg (microgram/day or ~1 µg/kg of body weight [8]. However, adult daily requirement ranged from 100 to 200 µg and 150 µg is the average requirement [8]. World Health Organization (WHO) recommended that at least 90% of households using adequately iodised salt which contains 15 parts per million (ppm) or more at the household level [6]. Iodine nutrient has been investigated thoroughly for over half a century and used as the treatment of goiter since 1820 before it was recognized as an essential micronutrient for health [1]. Iodine is a major important nutrient for mental development and physical growth and linked with thyroid hormones function [2]. Inadequate intake of iodine increases maternal risks and childhood mortality. Iodine deficiency particularly in pregnant mother increases the risk of developing neurological cretinism, myxedematous and dwarf cretinisms [3]. Iodine deficiencies potentially cause mental impairment and physical damage in children. Globally, due to iodine deficiency in the mother’s diet during pregnancy about 1.8 billion newborns affected with brain damage, reduced mental capacity and goiter [4]. All responsible governmental and nongovernmental agencies should give the highest priority for the elimination of Iodine 11 J Nutr Hum Health 2018 Volume 2 Issue 2
Citation:Ferede A. Evaluation of quantity and access of iodized salt using titration method in Arsi zone, Oromiya, Ethiopia in 2018: A Community based cross sectional study. J Nutr Hum Health 2018;2(2):11-16 The importance of preventing IDD recognized by World Health Assembly adopted in 1991 that the goal of eliminating iodine deficiency is a public health problem [7]. Programmatic monitoring of iodide salt intervention at the household level is essential to/prevents public health risk from iodine deficiency. Measuring the amount of iodine in salt with the help of standard titration method ensures programme functioning as planned and to provide information needed to take corrective action if necessary. Established efficient predictors indicate strength of intended and initiated accesses and quality of iodised salt to know the extent to meet the need of the population to prevent IDD. This study aimed to monitoring and evaluating iodised salt programmes performance to use as a baseline assessment for future study of mid urine iodine concentration (MUIC) among children aged between 6 to 59 months and to collect relevant data in the same population. Therefore, the main aim of this study is to evaluate the success of quantity and access of iodised salt programs to the market and reached to the households. maximum and minimum and frequency of iodine content in salt. One-Sample T Test used to determine if there were any significant differences in iodine values in salt samples versus to standard iodine values and comparing average iodine values in salt samples (ppm). The significance level was considered at p<0.05. Results Based on world Health Organisation recommendation, quality and adequacy used in the household has been classified based on their iodine content salt (ppm=mg iodine per kg of salt): under standard limit (<15 ppm) level; allowable standard limit from 15–40 ppm; and over standard limit (>40 ppm) [6]. Tests showed that 46 (38.33%) samples had standard value iodide in salt and 73 (60.83%) of the household’s salt had over allowable in standard limit and 1 (0.8%) of the HH had blown standard limit. Therefore, 119 (99.1%) households were with adequately iodised salt and the requirement of iodine per person per day also satisfactory. The mean and standard deviation of the salt iodine content were 45.29 (SD+14.47). The maximum and the minimum value of iodine in milligram (mg) per kilogram (kg) of salt were 84 and 15 respectively. Methods and Materials Study design Community based cross sectional study design was applied and a multistage stratified cluster sample was utilized to include 120 households and 8 different markets for this study. The study clustered to Arsi Zone (province) and stratified to 28 districts. Simple random sampling method was used to select eight districts from all districts. This more stratified into kebeles (small level of administrations) and 2 kebeles were selected randomly from each selected district and town. A total of 1200 households were selected with systematic random sampling from these kebeles and all households had provided 1200 salt samples and 24 edible salt samples were collected from major headquarter district markets found in selected districts. The most frequent value was 58 ppm of iodine in salt, 25 percentiles= 36.04, 50 percentiles=46.54, 75 percentiles=56.18 and 100 percentiles=83.74. The distribution of iodine in mg/kg of salt (ppm) among the households was normal (Figure 1). There was significant relationship between iodine values in edible salt samples taken from the HHs compeered to World Health Organization standard iodine values 40 ppm (p=0.001) (Table 1). Samples of salt from the HHs were statistically significant compared with mean iodine values in mg/kg in edible salt (p=0.0.001) (Table 2). Laboratory measurement of iodine in salt Based on WHO recommendation, shops and markets were assessed to identify and ensure the leakage of non-iodised salt into the general population which could limit the elimination of IDD [6]. Edible salt samples were collected from major 8 district headquarter markets and analysed with titration method. Test results showed that 9 (37.5%) had standard limit and 15 (62.5%) had above standard limit and no sample fund blow the standard limit of ppm iodine in salt which means no unconventional marketing sources for non-iodine salts. The mean and SD of salt test for iodide sampled from markets were 47.31 (+16.4) and the most frequent value was 58.3 ppm of iodine in salt, 25 percentiles=36.04, 50 percentiles=46.54, 75 percentiles=56.18 and 100 percentiles=83.74. The distribution of iodine in mg/kg of salt (ppm) among headquarter markets was normal (Figure 2). All salt samples tested using standard titration method in EPHI food and nutrition laboratory. Analysis procedure used all required principles and recommendations of the British Pharmacopeia and International Council for Control of Iodine Deficiency Disorders (ICCIDD) to determine the quality of iodine in salt [1]. For each sample the procedure was starting with weight 10 gm salt into conical flak and added 50 ml boiled distilled water and shakes to dissolve completely. Subsequently, pipette out 1 ml of 2 N sulphuric acid and 5 ml of 10% potassium iodide were added the solution. The solution turns yellow then the flask closed with stopper and put it in the dark place for 10 minutes in closed box. Poured 0.005N sodium thiosulphate into the burette and adjust the level to zero. After 10 minutes take the flask out of the dark and titrated with normal solutions 0.005M of sodium thiosulfate and stop titration when the solution turns to light yellow. Then 1 ml of 1% Starch solution was added and the solution turned to deep purple. Next, titration continued until the purple color disappeared and the solution becomes colorless. Then the burette reading record and the iodine content of the sample in parts per million interpreted from the attached table. Discussion This study focused to address the community and used standard salt analysis method to evaluate the initiated program of quantity and wide-ranging accesses of iodised salt for households to eradicate IDD. It was expected that less proportion of households would use iodine blow the standard (<15 ppm) but, this study findings were incredible that 99.1% of the substantial samples taken from HHs had good iodine (.>15) and unacceptable levels of iodised salt was very less (0.8%). This study salt test finding clearly stated that samples taken from headquarters Statistical analysis Statistical analysis carried out using IBM SPSS software Version.20. Distributive statistics determined using mean, SD, J Nutr Hum Health 2018 Volume 2 Issue 2 12
Citation:Ferede A. Evaluation of quantity and access of iodized salt using titration method in Arsi zone, Oromiya, Ethiopia in 2018: A Community based cross sectional study. J Nutr Hum Health 2018;2(2):11-16 Figure 1. Evaluation of quality and access of iodised salt test result using titration method that samples taken from households in Arsi zone, Oromiya, Ethiopia in 2018. Figure 2. Iodised salt test results for samples taken from households. One-Sample Test Test Value=40 Variables 95% CI of the Difference Lower T df Sig. (2-tailed) Mean Difference Upper Iodine in mg/kg of salt 4.004 119 0.001 5.29 2.67 7.91 Table 1. Average iodine values in salt samples compared to standard iodine values in edible salt (ppm). district markets had 100% good limit of iodine quantity in salt (Table 3) and in detail, 37.5% of the edible salt had standard iodised limit (15-40 ppm) and 62.5% was over standard iodised limit (40 ppm). Therefore, the proportion of salt samples from major headquarters district markets was potentially iodised in accordance with the average requirement (150 µg per person/ J Nutr Hum Health 2018 Volume 2 Issue 2 13
Ferede Table 2. Comparing mean iodine values in salt samples (ppm) taken from households. One-Sample Test Test Value=40 Variables 95% CI of the Difference T df Sig. (2-tailed) Mean Difference Lower Upper Iodine in mg/kg of salt 4.004 119 0.001 5.29 2.67 7.91 Table 3. Edible salt procedures result on titration method to determine iodine mg/kg of salt (ppm). Samples collected from December 5, 2017 to February 14, 2018 Date of laboratory analysis 20/02/2018 Variables Difference Volume in ml 5.4 4.3 3.2 4.8 4.6 4.5 3.5 1.6 4.9 5.5 2.9 5.5 2.5 2.5 5.5 3.2 3.5 7.6 7.9 6.4 5 5.1 3.9 3.4 Iodine Market Codes Markets and shops Initial Volume in ml Final Volume in ml in mg/kg salt 57.24 45.58 33.92 50.88 48.76 47.7 37.1 16.96 51.94 58.3 30.74 58.3 26.5 26.5 58.3 33.92 37.1 80.56 83.74 67.84 53 54.06 41.34 36.04 01.1 LB 01.2 LB 01.3 LB 02.1 LD 02.2 LD 03.1 Mi 03.2 Mi 03.3 Mi 04.1 Be 04.2 Be 04.3 Be 05.1 Be 05.2 Be 05.3 Be 05.4 Be 08.1 Ash 08.2 Ash 10.1 Sa 10.2 Sa 10.3 Sa 10.4 As 10.5 As 10.6 As 10.7 As Market L. Burkitu Market L. Burkitu L. Burkitu shop Market L. Dima Market L. Dima L. Michael Shop Market L. Michael Market L. Michael Shop Bekoji town Shop Bekoji town Shop Bekoji town Market Bekoji Market Bekoji Market Bekoji Market Bekoji Market Ashebeka Market Ashebeka Maket Sagure Maket Sagure Maket Sagure Market Asella Market Asella Market Asella Market Asella 6.2 11.6 15.6 18.8 0 4.6 9.1 12.6 14.2 19.1 6.1 9 14.5 17 19.5 0 3.2 6.7 14.3 18.2 0 5 10.1 14 11.6 15.9 18.8 23.6 4.6 9.1 12.6 14.2 19.1 24.6 9 14.5 17 19.5 25 3.2 6.7 14.3 22.2 24.6 5 10.1 14 17.4 day) of iodine. For that reason, successful introduction and accessed for iodised salt in Arsi Zone among HHs was good opportunity to increase remarkable progress in eliminating iodine deficiency. accesses [10]. Ethiopia Demographic and Health Survey (EDHS) reported that in 2011. 15% of household had accessed for some added iodine in edible salt. However, in Oromiya region was 17.4%, in Benishangul-Gumuz 39.7%, Addis Ababa 29.6% and Tigray 22.3% of HH used iodised salt in which Ethiopia had just on considerable progress [11]. History of iodised salt in Ethiopia expressed in different literatures and international documents. UNICEF in 2008 declared through revision on the progress in households consuming adequately iodised salt in Ethiopia since 1995had not greater than 20% [9]. In 2000 during, 28% Household consumed adequately iodised salt and the current iodised salt access increased with rapid progress due to two main iodisation plants and hundreds of small-scale units have been functioning in Ethiopia since 2002 [12-14]. A National survey data analysis for iodised salt coverage reported that in Ethiopia lower than 8% of households had edible salt added with iodine and more than one-half of the household population remains at risk of iodine deficiency; this occurred due to limited access to adequately iodised salt (<50) in the HH [10]. The above numerical explanation about HH used adequate iodised salt at national level has varied from the national report in 2011had justified 16% HH used adequate iodised salt [11]. However, this study finding was addressed the current iodisation small and large-scale producers to market accessed and HH used adequate iodised salt were interrelated. Finding of a study conducted in Asella town with rapid kit test showed that 62.9% HHs with consumed adequately iodised salt [15]. Further, study finding conducted in Northwest of Ethiopia showed that about 33.2% of households had adequately iodised salt [16]. The national survey which has carried out to measure the progress of adequacy of iodised in Ethiopia conducted using titration method in 2015 indicts that the 26% of the household participated in the study had salt with iodine (ppm) [17]. The current study finding reported that about 99.1% of the HH had consumed adequate amount iodine in salt (ppm) which was higher than study conducted in Asella town and in Northwest But optimistic to be improved compared to the past 5 years 14 J Nutr Hum Health 2018 Volume 2 Issue 2
Ferede Ethiopia because both studs used rapid test which were deficient to predict the amount of iodine in salt (ppm). But this study made high reliable titration test and addressed wide-range of study area and high population (HHs and headquarter markets) were included in the study. In more, investment on iodisation plants relatively increasing within short period than the past years and this increasing comparative access and quantity of iodine in the country [13]. the right to refuse or terminate at any point of our request of edible salt. The information provided by each respondent was kept confidential. References 1. Mannar International Council for Control of Iodine Deficiency Disorders, UNICEF. Salt iodization for the elimination of iodine deficiency. ICCIDD, Netherlands. 1995. MV, Dunn JT. Micronutrient Initiative, Conclusion 2. Hetzel B. Iodine deficiency disorders (IDD) and their eradication. Lancet. 1983;2:1126-29. This study highlighted iodised salt access was higher and most of HHs consumed adequate quantity of iodide ppm throughout the community. The majority of iodised salt samples from the HH and market contained high amount of iodine more than the standard limit. Currently, we have been recommended to collect urine specimens to study Mid Urine Iodine Concentration persuasively on this study population’s child. This test of iodine concentrations in urine will provide adequate information on the iodine nutrition a profile of this study community. But study on segmented population may not provide efficient information to consider as an iodine-deficiency-free country. Establishing a proper monitoring system at different levels and surveillance system are crucially needed to ensure proper salt iodization and adequate intake of iodide by households. A premature evaluation and monitoring the quantity iodine in salt during production and distribution shall be altered to sustain obtained good progress to prevent and control IDD. 3. Lamberg BA. Iodine deficiency disorders and endemic goitre. Eur J Clin Nutr. 1993;47:1-8. 4. Zimmermann MB. The effects of iodine deficiency in pregnancy and infancy. Paediatric and perinatal epidemiology. Laboratory for Human Nutrition, Institute of Food, Nutrition and Health, Swiss Federal Institute of Technology. 2012:26:108-17. 5. Nathan R. Food fortification legislation and regulation manual, (2nd edn). Program against micronutrient malnutrition. Atlanta, GA, USA. 1995. 6. World Health Organization. Assessment of iodine deficiency disorders and monitoring their elimination. A guide for programme managers: (3rd edn). Geneva. 2007. 7. World Health Organization, Assessment of Iodine Deficiency Disorders and Monitoring their Elimination A guide for programme managers. WHO/NHD/01.1 (2nd ed). 2001. Funding The research was fully funded by Arsi University, Ethiopia. 8. Food and Nutrition Board, Institute of Medicine. Dietary Reference Intakes. Washington, DC: National Academy Press. 2001;258-89. Acknowledgments Authors would like to thank Arsi University for financial support. Our special gratitude also goes to local administrative health office of study area, study participants, health post facility workers for their considerable cooperation at the time of data collection. Furthermore, we would like to express our deep appreciation towards Arsi Zonal Health Department and Ethiopian Public Health Institute and EPHI food and nutrition laboratory workers for their unlimited technical support. 9. The United Nations Children's Fund sustainable elimination of iodine deficiency progress since the 1990. World Summit for Children: ISBN: 978-92-806-4304-6, 2008. 10. Knowles JM, Garrett GS, Gorstein J, et al. Household coverage with adequately iodized salt varies greatly between countries and by residence type and socioeconomic status within countries: Results from 10 national coverage surveys. J Nutr. 2017:147:1004S. Author Contributions Habtemariam has done the conception of the design of the research project, data collection, data entry, analysis, preparation and write up manuscript and appraisal. I read and approved the final manuscript for publication 11. Central Statistical Agency Ethiopia. Ethiopia Demographic and Health Survey, 2012. 12. Pandav CS. Field validation of salt iodine spot testing kit using multiple observers to assess the availability of iodized salt, Amsterdam, Elsevier, 2000: 1039-43. Ethical Approval This research was approved by Ethical Review Committee of Arsi University. Letter of permission was obtained from Arsi Zone administrative and health department offices. At the end, we obtained permission from 8 district administrative offices 16 Kebeles (Smallest Administrative Units) which were site for data collection administrations offices. In addition, all of the study participants HH were informed about the purpose of the study and finally the respondents were notified that they have 13. http://minerals.usgs.gov/minerals/pubs/country/2002/ djeretsomyb02. 14. UNICEF. Control and Prevention of Iodine Deficiency Disorders (IDD) in Ethiopia. UNICEF Addis Ababa, Ethiopia; 2005. 15. Hawas SB, Lemma S, Mengesha ST, et al. Proper utilization 15 J Nutr Hum Health 2018 Volume 2 Issue 2
Ferede of adequatly iodized salt at house hold level and associated factores in Asella Town Arsi Zone Ethiopia: A community based cross sectional study. J Food Process Technol. 2016;7:573. 17. Hailu A. Remarkable progress against iodine deficiency in Ethiopia. Ethiopian National Micronutrient Survey Report: Ethiopian Public Health Institute, Ministry of Health. 2016. IDD Newsletter 2017. http://www.ign.org/newsletter/idd_ aug17_ethiopia.pdf 16. Abebe Z, Tariku A, Gebeye E. Availability of adequately iodized in Northwest Ethiopia: A cross-sectional study. Arch Public Health. 2017;75:33. *Correspondence to: Abebe Ferede Department of Public Health Arsi University Ethiopia Tel: +2510920164082 E-mail: abebeferede027@gmail.com 16 J Nutr Hum Health 2018 Volume 2 Issue 2