Download
1 / 35
360 likes | 761 Views
Thomas Costa, Managing Director, Clearing and Settlement, DTCC ACSDA Leadership Forum October 8, 2007. National Securities Clearing Corporation and Fixed Income Clearing Corporation. Organizational Structure. NSCC and FICC Common Features.

E N D
Thomas Costa, Managing Director, Clearing and Settlement, DTCC ACSDA Leadership Forum October 8, 2007 National Securities Clearing Corporation and Fixed Income Clearing Corporation
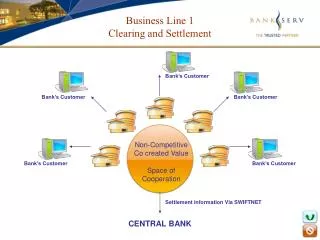
NSCC and FICC Common Features • SEC-regulated clearing corporations and central counterparties (CCPs) • Organized under New York business code • Wholly-owned subsidiaries of DTCC • Standard and Poor’s AAA rated • Comparable core services using similar business models • Same Board of Directors (for all DTCC subsidiaries) • Many of the same or related participating dealers, clearing banks • Proven operating history
What Our CCPs Do • Record locked-in trades from our exchanges and match OTC trades with Real Time Trade Matching (RTTM) • Establish a single net position for each member in each issue traded • Multilateral, not bilateral netting • NSCC and FICC interpose themselves between their members, “novate” trades between net settlement parties, and risk-manage the obligations until settled. • All members settle “net” with NSCC or FICC as their “novated” settlement counterparty • This greatly reduces number of securities movements required by offsetting between the firm’s own net debit and credit positions.
Benefits of CCP’s Business Model • Allows for efficient, high volume trading, especially anonymous trading in inter-dealer markets • Guarantees ultimate settlement, using common risk management for counterparty and systemic risk • Netting of securities and payments decreases the number of failed trades; manages fails for regulatory relief • Adjusts for corporate action effects on trades pending settlement • Net Settlement decreases financial resources needed to operate in the market and enhances settlement liquidity
Broker / Dealers Proprietary Trading Prime Broker Correspondent Clearing Inter-Dealer Brokers Commercial Banks GSEs (Fannie Mae and Freddie Mac) Insurance Companies Investment Companies(Mutual Funds) Investment Managers(EPN Only) International Organizations, e.g. BIS Other Investment Portfolios NSCC and FICC Participants
A Wide Range of Markets • NYSE Euronext • Nasdaq • Other OTC Markets • U.S. Treasury Securities Market • Mortgage-Backed Securities Market • Regional U.S. Exchanges • Exchange Traded Funds • Electronic Trading Systems • ECNs (Electronic Communications Networks) • ATSs (Alternative Trading Systems)
A Closer Look at NSCC for NYSE Trades Broker Dealer/ Market Trades BuyingBroker Selling Broker Buying and selling members buy/ sell a security – for their own account, or on a correspondent basis or customer’s order. Trade is executed on an exchange or marketplace; locked in and sent real-time to NSCC. NSCC records the trade, reports it to both sides, risk-manages the trade and calculates net margin on the overall portfolio of pending settlement and collects any required collateral. NSCC NSCC becomes the single counterparty to each net settling position for each issue that each broker trades. 97% of settlement obligations net away. NSCC instructs securities deliveries and receives at DTC. DTC
Cleared Products FICC Govt Securities Division • Treasury Bills, Bonds, Notes • Treasury Zero Coupon Securities • Treasury Inflation Protection Securities (TIPS) • Non-Mortgage-Backed Agency Securities • Fixed-Rate and Adjustable Rate Fannie Mae, Freddie Mac and Ginnie Mae Mortgage-Backed Securities (for GCF Repo) • FICC Mortgage-Backed Securities Division • Fixed Rate TBA Mortgaged-Backed Securities Issued By: • Ginnie Mae • Fannie Mae • Freddie Mac • Actively Traded Adjustable Rate Agency MBS for Clearing • All ARMs for EPN NSCC • OTC Equities • Listed Equities • ETFs • Municipal Bond • Corporate Bonds • Unit Investment Trusts • Canadian Depository Link ________ • Insurance • Mutual Funds Full CCP Guaranty not offered (yet)
Trade Comparison – RTTM • Off-exchange trades are submitted to FICC by buyers and sellers and instantaneously matched by RTTM • Strive to achieve 100% match intraday • Risk mitigation in capturing trades as they occur, not end of day • Supports straight-through processing • Uses a standardized international format to accept trades from members • Approximate dollar value of trades received is $3 trillion daily
NSCC – Average Daily and Peak Day Sides Peak Day Sides in Millions 98.5 50.1 Average Daily Side in Millions 50.8 34.0 2006 2007* * Data through 6/30/2007
Buy June 8, 2006 Buy Buy Buy Sell Sell Sell 97% 99% 98% Volume Peaks and Netting June 6, 2003 May 10, 2004 August 16, 2007 $766B $495B $1.02T $2.23T Sell 98% $16.6B $12.5B $14.7B $31.1B 30.2 million sides 39.6 million sides 62.7 million sides 125.1 million sides
Clearing and Settlement: The Role of Netting • What it does: Netting significantly reduces settlement obligations and associated risks while freeing up a vast amount of capital for additional investment in the market. • How? By reducing or netting down the total number of trade obligations requiring financial settlement by offsetting purchases against sales of the same security. • Result: At day’s end, each dealer has a single net settlement obligation per issue. • Netting eliminates the need for financial settlement of roughly: • 98% of equity trades • 94% of mortgage-backed securities trades • 76% of government securities trades
Dealer B Dealer A Dealer C Dealer A Dealer C 50,000,000 50,000,000 50,000,000 50,000,000 CCP Example: Trades Before Net Results of The Netting Process
NSCC – Netting 2007* $122 trillion Total YTD Obligations Requiring Financial Settlement Reduced by 98% Net: $2.3 trillion * Data through 6/30/2007
Looking Ahead to New Services • Pool Netting and increasing CCP Services for Mortgage-Backed Securities • Prime Brokering for Government Securities • Inter-bank GCF Repo for Government Securities • Institutional ID Net for Equities • EuroCCP in Europe
How CCPs Add Value CCPs create value for three distinct stakeholders: • Market participants and the investors they represent, who benefit from the guarantee, liquidity and efficient capital preservation. • Marketplaces and issuers benefit from confidence that the neutral, risk-managed CCP provides structure, network effects and reduces volume constraints. • Regulators gain in progressing their public policy objectives, and safety and soundness.
NSCC and FICC’s Shared Mission • Ensure the safety and soundness of the U.S. equity and fixed income marketplaces • Centralize, standardize, and automate post-trade processing • Minimize risk • Increase operational efficiencies • Reduce costs • Create innovative, flexible technological solutions • Meet the industry’s growing need for seamless global trading solutions
Product Annex and Selected Statistics NSCC Services • Trade Capture and Reporting • Continuous Net Settlement • Depository Settlement (DTC) • Risk Management • Automated Customer Account Transfer Service (ACATS) • Cost Basis Reporting Service (CBRS) • Correspondent Clearing Service • Index Share Processing
NSCC Services(continued) • Reconfirmation and Pricing Service (RECAPS) • Stock Borrow Program • Prime Broker Services • Dividend Settlement Service • Envelope Settlement Service • Funds Only Settlement Service
GSD Services • Real-time Trade Matching (RTTM) • Netting • Settlement • Delivery Versus Payment (DVP) • Fed Funds over FedWire • Risk Management • Repurchase (Repo) Agreements • Overnight • Term • Forward Starting
GSD Services (continued) • General Collateral Finance (GCF) Repos • Collateral Substitutions for Repos • Auction Takedown (Treasury and Freddie Mac) • Sponsored Membership • Cross-Margining
MBSD Services • Real-time Trade Matching (RTTM) • Settlement Balance Order Netting and Trade-for-Trade Processing • Electronic Pool Notification (EPN) • Specified Pool Trade Matching Service • Testing new EPN Pool Substitution Service • Pool Netting and CCP Services planned for 2008
NSCC – Average Daily and Peak Day Sides 98.5 50.8 50.1 36.5 34.0 30.2 26.2 26.0 24.7 22.9 18.9 16.2 Average Daily Side in Millions Peak Day Sides in Millions * Data through 6/30/2007
NSCC – Netting 97% 97% 97% 98% 98% 98% * Data through 6/30/2007
GSD – Average Daily and Peak Day Dollars $6.20 $6.19 $5.92 $5.13 $5.06 $4.85 $3.92 $3.50 $3.50 $2.83 $2.16 $2.12 Total Average Day Dollar Value In-Net in Trillions Peak Day Dollars in Trillions * Data through 6/30/2007
GSD Average Daily Dollar Value of Trades and Obligations(Dollars in Trillions) * Data through 6/30/2007
GCF Repo – Average Trade Size $629,825,382 DVP Repo – Average Trade Size $ 41,789,942 Buy/Sell – Average Trade Size $ 11,966,770
MBSD – Average Daily and Peak Day Dollars in Clearing (Par) $926 $906 $767 $614 $533 $363 $440 $305 $303 $270 $271 $202 Average 48 Hour Day Dollars in Billions Peak Day Dollars in Billions * Data through 6/30/2007
MBSD Average Monthly Clearing Values Par in Trillions * Data through 6/30/2007
MBSD: EPN - Average Daily 48 Hour Day Dollars and Peak Day Dollars (Current Face in Billions) $614 $608 $609 $535 $541 $437 $215 $191 $195 $179 $180 $155 Average 48 Hour Day Dollars in Billions Peak Day Dollars in Billions * Data through 6/30/2007