Download
1 / 23
230 likes | 232 Views
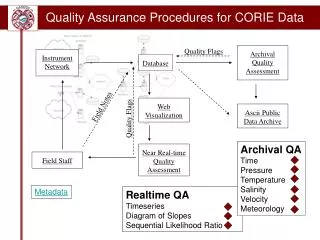
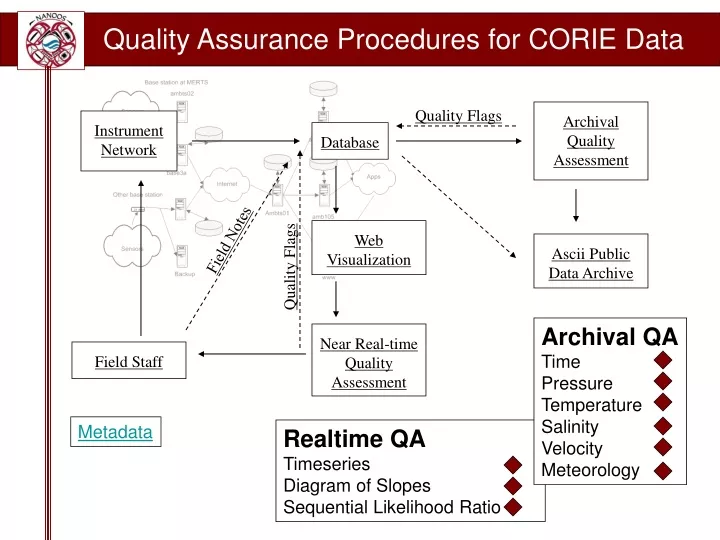
Quality Assurance Procedures for CORIE Data. Quality Flags. Archival Quality Assessment. Instrument Network. Database. Web Visualization. Field Notes. Ascii Public Data Archive. Quality Flags. Archival QA Time Pressure Temperature Salinity Velocity Meteorology.

E N D
Quality Assurance Procedures for CORIE Data Quality Flags Archival Quality Assessment Instrument Network Database Web Visualization Field Notes Ascii Public Data Archive Quality Flags Archival QA Time Pressure Temperature Salinity Velocity Meteorology Near Real-time Quality Assessment Field Staff Metadata Realtime QA Timeseries Diagram of Slopes Sequential Likelihood Ratio
Real-time Quality Assurance • Visual evaluation of data quality 4 times a week • Automated testing for biofouling, checked by operator • Real-time checks result in notification of field staff • No database storage of notification • No incorporation of assessment into database quality flags • Non-automated use of assessment to deactivate web display of real-time data
Feb Mar Apr CTD QA ADP QA ADP QA Archival quality assurance • CTD and ADP data quality assessment on a monthly basis. • 1 month lag in assessment (January data tested at the end of February) • CTD QA dependent on subsequent data • ADP QA not dependent on subsequent data • Data which passes QA is stored in ascii public archive • QA not used to generate Quality flags in database
Timeseries • Timeseries of Depth, Salinity, Temperature displayed on website • Inspected for instrument failure or biofouling
Cross-estuary slope diagram • S-T plot of all stations • Almost all stations should produce the same s-t line • Chnke, ogi01, and ogi02 are exceptions Mottb possibly biofouled Extensive biofouling
Sequential Likelihood Ratio • Based on linear S-T relationship across estuary • Accounts for local variation from linear relationship • Depends on S and T at daily maximum S at each station, river T and Ocean T • Modeled Sclean and Sbiofouled based on T, TR, and TO compared to measured S • Station specific ratio cutoff, trained on known biofouled data • Used to generate a visual display • Currently trained for lower estuary stations • Extension of method to lateral bays under development • Could be used for archival QA 34 Scl SM Sbf 0 TR TM TO
CTD: time • Radio network can produce data with bunched time values • Expected timestep between data points is determined from data (median timestep) • If timesteps are shorter than median time step, with a gap preceding bunch that has correct length, then data are reassigned times evenly spaced over gap • If gap is longer than data clump, then data clump is discarded
CTD: Salinity • Main concern is biofouling, but Conductivity sensors can also fail • Sensor failure is detected by range check (S<0 or > 35) and by visual inspection • Biofouling is tested by using cross estuary s-t relationship • Determine median s-t slope for each tidal period
CTD: Salinity • Compare each instrument’s s-t slope for that tidal period to median • Cutoff: abs(local slope) – abs(median slope) > 0.2 => biofouled • When an instrument is considered biofouled, preceding data is considered biofouled until a clean cutoff is exceeded • Clean cutoff: abs(local slope) – abs(median slope) < 0 • When median slope approaches 0, method fails • If instrument is biofouled after period of near-zero slope, then entire period of near-sero slope is considered biofouled
CTD: Salinity • Automated assessment produces both false positives and false negatives • Results are manually checked Transient Biofouling False positive False negative
Storage of Quality Assessment • Data records which do not meet minimal quality standards are stored in the raw data files, but do not enter the database • Notices of observer suspicion of data quality are not currently stored in a formal manner, and are not entered into the database • Archival quality assurance procedures currently generate public archive files which contain only data which has passed the quality assurance tests • The quality assurance flagging is not currently stored in the database
Models • A model of the clean signal • Temperature and salinity variation are correlated. Model daily maximum salinity and corresponding temperature are jointly Gaussian. • The probability density for observing the sequence of salinity measurements {sn }, given the sequence of recorded mixing coefficients {Tn }, and a cleansensor p({sn} | {Tn }, clean ) • A model of the biofouledsignal • Allows for different degradation ratesm for each biofouling episode, and arbitrary onset timet with these parameters fit to incoming data. p({sn} | {Tn }, m, t, biofouled ) = p ({sn} | {Tn }, biofouled ) • m and t are unknown • These parameters are fit to the data sequence by maximum likelihood.
Output m mn gn m1 m2 g2 g1 Expert Network 1 Expert Network 2 Expert Network n Gating Network Input vector T Regression Model: Mixture of Experts • The correlation between salinity and temperatures is not stationary. • The detector system needs to switch between seasons. • A mixture of local models can cover different behaviors. • Both of experts and gating network receive same input vector. • Each expert network tackles each of the different seasons. • The gating network decides which of the experts should be used. • Regression output Ref.
Approach and Results • Parameterized novelty detectors embedded in a sequential likelihood ratio test • SLR at current time N is compared to a threshold to identify biofouling events. • Results • Automated biofouling detectors deployed throughout the estuary. Monitored by observer, and used to send out notices of biofouling events, but not incorporated directly in to data flagging. Ref.
Criteria for rejecting data before it enters the database • rserial2db rejects data lines based on failed checksum or garbled line Short input line: [RE^M], skipping. Skipping unknown data line: [abedCT 0000 00 00 00 00 00 1516D +20.856, +07.947, +19.0889*6F] Checksum failed for data line: W,üR'¢í?»TW%X¯»U»PT$CRdsdmaRV0CTDd00730R seabedCT 0000 00 00 00 00 00 1516D +09.502, +08.366, +08.0447*60 Short input line: [], skipping. Skipping unknown data line: [W,ýS'¢è¾?»T W%Y»S»UT10394A141322 1316:0 746:1 :2 :3 :4 532:5 -1806:6 :7] Line length = 162, must be 81 to 83 chars long, skipping data line: 10395A138173 1193:0 770:1 :2 :3 :4 282:5 :6 10395A138177 1192:0 770:1 :2 :3 :4 278:5 :6 :7 • Most data is not subjected to sanity check (e.g salinity <0 or > 35) • Certain stations are handled as special cases and are subject to sanity checks (ogi02 is checked for negative sal, temp, and cond)
Metadata Metadata for Operational Resources • Partners • Name • Abbreviation • Adminstrative contact • Scientific contact • Technical contact <- when things go wrong. • Sensor inventory • Owner, Type, Manufacturer, Serial number, • Deployment • Station ID, lat/lon, depth,
Metadata Operational metadata (cont.) • Models • Owner, developer, version, domain • Output formats • Native binary? • NetCDF (need CDL descriptions) • OPeNDAP URLs or LAS if deployed • All operational metadata into Postgres with a web interface for modifications (this has been done, grab schema from SEACOOS or GoMOOS?)
CORIE Data Management Data Flow
CORIE Data Management Base Station Processes • Rserialv2db • Raw input from serial port timestamped and written to disk. • Metadata, timestamp added to data line (config.txt). • Some processing (Coastal Leasing) and quality control (checksums). • Pre-processed data line written to disk. • Raw and pre-processed data lines written to transfer table in a local relational database. • Pusher • Reads records from local DB on base station, FIFO. • Writes records to remote DB on ambts01. • Deletes records from local DB on base station.
CORIE Data Management At OGI • Telemetry server - ambts01 • Rack mounted, 1GB memory, 2.4Ghz single CPU, 32GB mirrored disk, RHE Linux. • PostgreSQL • parsedb2.pl • Reads records from transfer table. • Parses record, processes data, and deposits to proper tables in telemetry database on ambts01. • Replicates to production databases on amb104, amb105. • Sets a flag in the transfer table to indicate record was processed and replicated. • Data ready for applications from production database servers on amb104 and amb105.
CORIE Data Management Monitoring and Alerting • Monitoring • Monitor incoming data stream • Observation network • Monitor individual instruments • Alerting • E-Mail • Pager • Oncall, troubleshooting. • CORIE Base Station Operations Manual • CORIE Serial Port Reader Manual • Telemetry ONCALL Information
CORIE Data Management Maintenance on Base Station • System • OS updates • Hardware failures • Security issues • Weekly data files • Rserialv2 signals • HUP – Re-read configuration file, instrument changes • USR1 – Rotates the raw and partially processed data files • Database • Vacuum, analyze, log file rotation and cleanup • Database table used for data transfer is usually empty
CORIE Data Management Real Time Data Transfer • Currently – • $CRjettaRV1CTDd00640R seabedCT 2005 03 27 10 06 06 1454D 15.605 09.238 13.4218 • Going forward, XML for RT xfer • MarineXML standard • Upload to web application, FTP, SOAP, or direct to DB • Sample CTD record. • Downside is XML bloat • Metadata web forms • Station name, location, instrument • Event logging