Download
1 / 1
10 likes | 121 Views
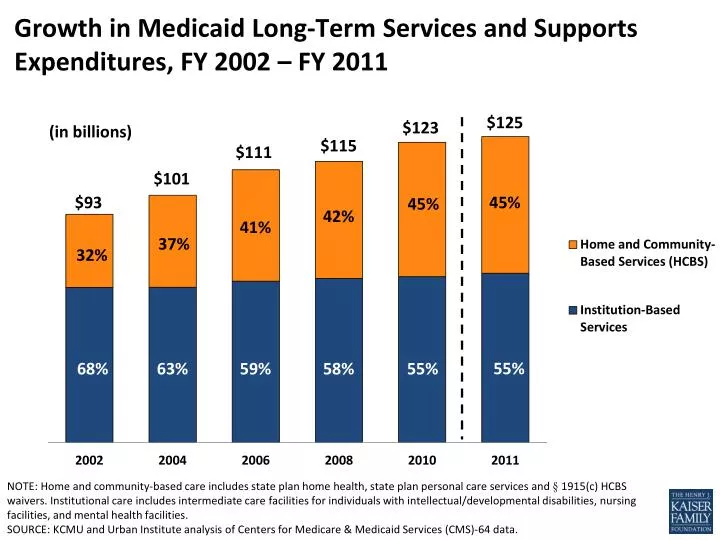
Growth in Medicaid Long-Term Services and Supports Expenditures, FY 2002 – FY 2011. (in billions). $125. $123. $115. $111. $101. 45%. 45%. 42%. $93. 37%. 41%. 32%. 68%. 58%. 55%. 55%. 63%. 59%.

E N D
Growth in Medicaid Long-Term Services and Supports Expenditures, FY 2002 – FY 2011 (in billions) $125 $123 $115 $111 $101 45% 45% 42% $93 37% 41% 32% 68% 58% 55% 55% 63% 59% NOTE: Home and community-based care includes state plan home health, state plan personal care services and § 1915(c) HCBS waivers. Institutional care includes intermediate care facilities for individuals with intellectual/developmental disabilities, nursing facilities, and mental health facilities. SOURCE: KCMU and Urban Institute analysis of Centers for Medicare & Medicaid Services (CMS)-64 data.