Download
1 / 19
190 likes | 284 Views
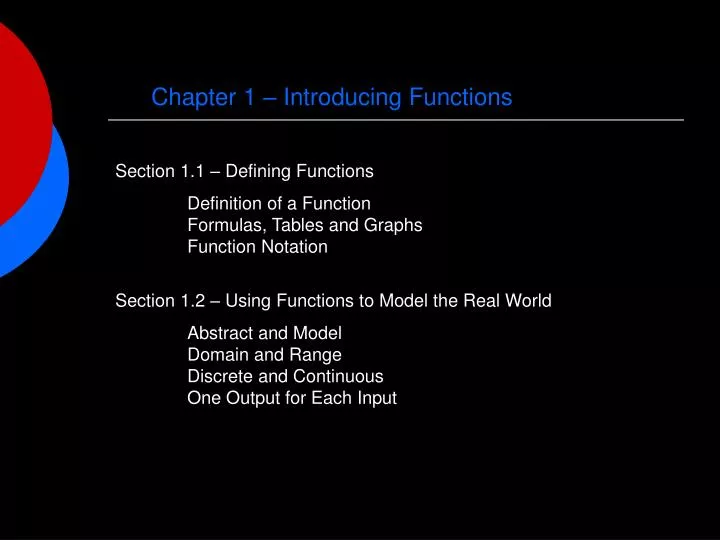
Chapter 1 – Introducing Functions. Section 1.1 – Defining Functions Definition of a Function Formulas, Tables and Graphs Function Notation Section 1.2 – Using Functions to Model the Real World Abstract and Model Domain and Range Discrete and Continuous One Output for Each Input.

E N D
Chapter 1 – Introducing Functions Section 1.1 – Defining Functions Definition of a Function Formulas, Tables and Graphs Function Notation Section 1.2 – Using Functions to Model the Real World Abstract and Model Domain and Range Discrete and Continuous One Output for Each Input
Exercises from Sections 1.1 and 1.2 1/10 – domain of men’s shoe function 5/10 – domain 6/10 - domain 2/13 – function notation 3/13 – function notation 4/13 – function notation 5/13 – function notation 6/13 – function notation 11/32 – function notation 12/32 – function notation 23/33 – weird function
Section 1.3Watching Functions Values Change pages 17 - 29
Section 1.3 – Watching Function Values Change Example 1: women’s shoe size functionw(x) = 3x – 21 y = 3x - 21 y (shoe size) depends on x (foot measurement)HOW? What is the change in shoe size when: foot length increases from 9 inches to 9 1/6 inches (by 1/6) foot length increases from 9 1/6 to 9 1/3 inches (by 1/6) foot length increase from 10 inches to 10 ½ inches (by 1/2) foot length increases by a full inch during the course of a career.
Example 1 foot length increases from 9 inches to 9 1/6 inches (by 1/6) shoe size increases by 0.5 foot length increases from 9 1/6 to 9 1/3 inches (by 1/6) shoe size increases by 0.5 foot length increase from 10 inches to 10 ½ inches (by 1/2) shoe size increases by 1.5 foot length increases by a full inch during the course of her career. shoe size increases by 3
Example 1 women’s shoe size functionw(x) = 3x – 21 y = 3x - 21 y (shoe size) depends on x (foot measurement)HOW? Do you see a pattern? change in y is always 3 times the change in x or change of one unit in x always produces a change of 3 units in y or rate of change is 3 [shoe sizes per 1 inch]
Section 1.3 – Watching Function Values Change Definition (pg 17)The rate of change of y with respect to x is given by: Definition (pg 18)The average rate of change of any function y = f(x) from x = a to x = b is the ratio:
Example 1 women’s shoe size functionw(x) = 3x – 21 y = 3x - 21 y (shoe size) depends on x (foot measurement)HOW? Use the definition to determine the average rate of change of the women’s shoe size function for: x from 9 to 9 1/6 x from 9 1/6 to 9 1/3 x from 10 to 10 1/2 x from 9 to 10 x from a to b
Example 1 Can we see the rate of change on the graph of the women’s shoe size function? Constant Rate of Change = Straight Line Graph
Section 1.3 – Watching Function Values Change Example 2the area of a square depends on the length of its side A(s) = s2 HOW? Use the definition to determine the average rate of change of the area function for: s from 1 to 2 s from 2 to 3 s from 3 to 4
Example 2 Use the figures to determine the average rate of change of the area function for: s from 1 to 2 s from 2 to 3 s from 3 to 4
Example 2 Can we see the rates of change on the graph of the area function? Rate of Change is Changing
Section 1.3 – Watching Function Values Change The Shape of a Graph We say a function is increasing if the value of the dependent variable increases as the value of the independent variable increases i.e. as we read the graph from left to right, the y values of points on the graph get larger. i.e. the graph rises as we read left to right
Section 1.3 – Watching Function Values Change The Shape of a Graph We say a function is decreasing if the value of the dependent variable decreases as the value of the independent variable increases i.e. as we read the graph from left to right, the y values of points on the graph get smaller. i.e. the graph falls as we read left to right
Section 1.3 – Watching Function Values Change The Shape of a Graph What about average rates of change for increasing functions?
Section 1.3 – Watching Function Values Change The Shape of a Graph What about average rates of change for decreasing functions?
Section 1.3 – Watching Function Values Change The Shape of a Graph We say the graph of a function is concave up if the rates of change increase as we move left to right. We say the graph of a function is concave down if the rates of change decrease as we move left to right.
Where is f increasing? Where is f decreasing? Where is graph concave up? Where is graph concave down?
Section 1.3 – Watching Function Values Change Homework: Page 33: #25-31Page 40: #1, 2 Turn in: 26,27,30, 31 Read and begin work on Lab 1B (pp 46-50)