Download
1 / 10
100 likes | 158 Views
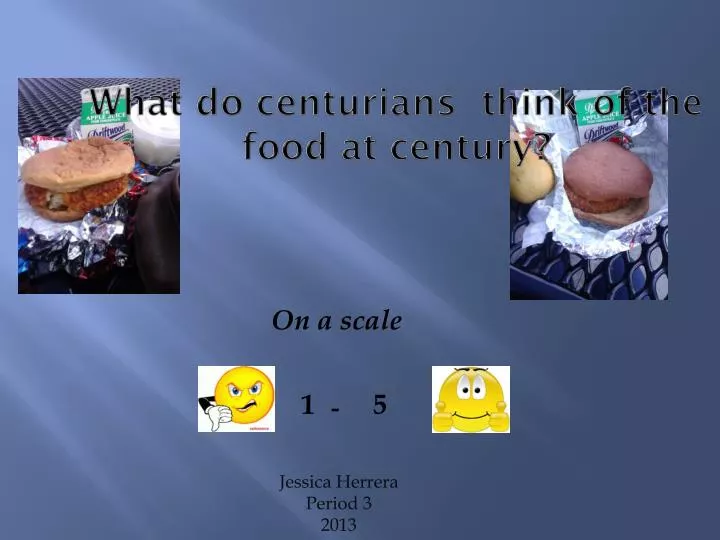
What do centurians think of the food at century?. On a scale. 1. 5. -. Jessica Herrera Period 3 2013. California Standards :.

E N D
What do centurians think of the food at century? On a scale 1 5 - Jessica Herrera Period 3 2013
California Standards : •8.0 Student organized and describe distribution of data by using of different methods, including frequency table, histogram, standard line and bar graphs, stem-and-leaf displays, scatter plots, and box of whisker plots. •17.0 Students determine confidence interval for a simple random sample from a normal distribution of data and determine the sample size required for a desired margin of error. •18.0 Student determine the P-value for a statistic for a simple random sample from a normal distribution
Hypothesis We believe that most of centurians will rate the food a one.
25 freshmen 25 Sophomores 25 Juniors 25 Seniors Data Collection We clustered the centurians into separate grade levels(freshmen sophomores , juniors and seniors) and asked during school. Then stratified them into 25 centurians of each grade level.
One being the worst Five being the best data Freshmen: 1,1,2,1,4,3,2,3,1,2,3,1,1,3,3,4,2,2,2,2,2,2,3,2,3 Sophomores: 1,1,1,1,1,4,3,3,2,1,2,3,2,1,2,3,3,2,1,3,2,3,1,1,2 Juniors: 1,1,1,1,2,1,1,1,2,1,3,2,1,3,2,1,3,2,3,3,2,1,3,1,1 Seniors: 1,1,1,1,2,1,1,1,2,1,3,2,2,1,1,2,1,3,2,1,3,1,2,1,1
statistics From the survey, the mean of centurians scaling the food at century on a scale of 1-5 is 1.87 and the standard deviation is .8792 .
Confidence interval 95% confidence level Z interval (1.6977, 2.0423) We are 95% confident that the mean of students scaling the food at century on a scale 1-5 is between 1.69 ~ 2.04 .
Hypothesis testing 1. Hypothesis 2. Test Statistics Z- test P- value= 4.444 E-23 =0.05 0 At 5% level of significance we reject the there is not enough evidence to support the claim.
Error analysis • Our sample mean is 1.87 on a scale 1-5, and for the population mean is between 1.69 2.04 on a scale 1-5. • •Our sample errors : • having students absent, students not being truthful or they don’t eat the food at century.
conclusion We hypothesized that centurians would scale the food a one on a scale 1-5. In our survey of 100 centurians, we found that the mean was 1.87 with the standard deviation of .8792 . We conclude that the population mean is between 1.69 & 2.04 on a scale 1-5 with 95% confident.