Download
1 / 1
10 likes | 148 Views
N. N. E. E. N. E. 3-D study of the expansion of the nebula of the symbiotic Mira He2-147. M. Santander-García 1 , R.L.M. Corradi 2,1 & A. Mampaso 1 1 Instituto de Astrofísica de Canarias, Tenerife, Spain 2 Isaac Newton Group, La Palma, Spain e-mail to: miguel.santander@iac.es. ABSTRACT

E N D
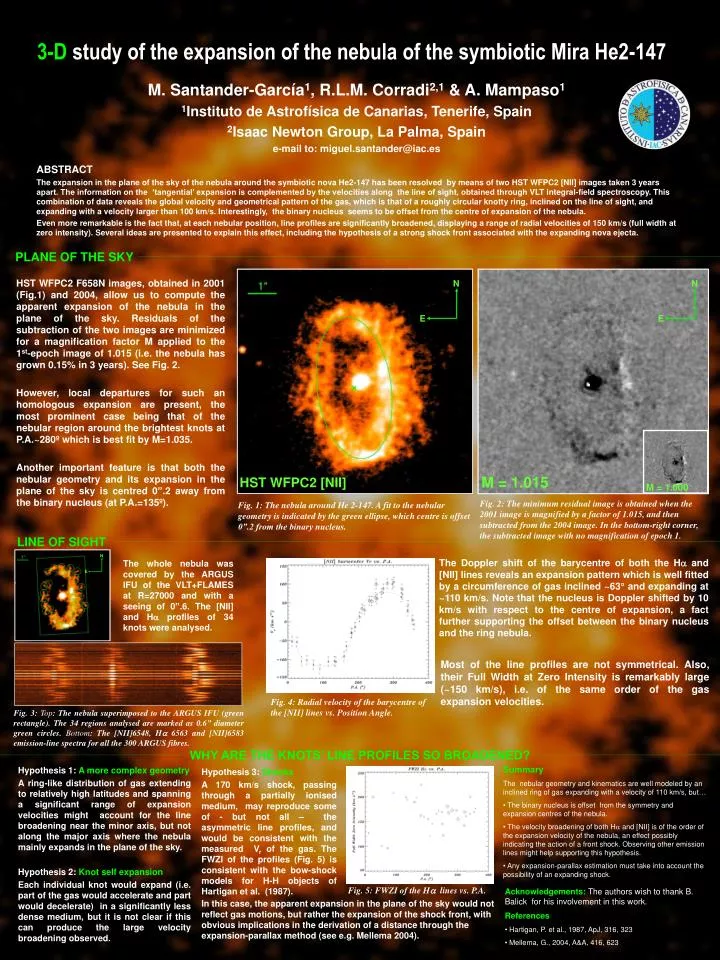
N N E E N E 3-Dstudy of the expansion of the nebula of the symbiotic Mira He2-147 M. Santander-García1, R.L.M. Corradi2,1 & A. Mampaso1 1Instituto de Astrofísica de Canarias, Tenerife, Spain 2Isaac Newton Group, La Palma, Spain e-mail to: miguel.santander@iac.es ABSTRACT The expansion in the plane of the sky of the nebula around the symbiotic nova He2-147 has been resolved by means of two HST WFPC2 [NII] images taken 3 years apart. The information on the ‘tangential’ expansion is complemented by the velocities along the line of sight, obtained through VLT integral-field spectroscopy. This combination of data reveals the global velocity and geometrical pattern of the gas, which is that of a roughly circular knotty ring, inclined on the line of sight, and expanding with a velocity larger than 100 km/s. Interestingly, the binary nucleus seems to be offset from the centre of expansion of the nebula. Even more remarkable is the fact that, at each nebular position, line profiles are significantly broadened, displaying a range of radial velocities of 150 km/s (full width at zero intensity). Several ideas are presented to explain this effect, including the hypothesis of a strong shock front associated with the expanding nova ejecta. PLANE OF THE SKY HST WFPC2 F658N images, obtained in 2001 (Fig.1) and 2004, allow us to compute the apparent expansion of the nebula in the plane of the sky. Residuals of the subtraction of the two images are minimized for a magnification factor M applied to the 1st-epoch image of 1.015 (i.e. the nebula has grown 0.15% in 3 years). See Fig. 2. However, local departures for such an homologous expansion are present, the most prominent case being that of the nebular region around the brightest knots at P.A.~280º which is best fit by M=1.035. Another important feature is that both the nebular geometry and its expansion in the plane of the sky is centred 0”.2 away from the binary nucleus (at P.A.=135º). M = 1.015 HST WFPC2 [NII] M = 1.000 Fig. 2: The minimum residual image is obtained when the 2001 image is magnified by a factor of 1.015, and then subtracted from the 2004 image. In the bottom-right corner, the subtracted image with no magnification of epoch 1. Fig. 1: The nebula around He 2-147. A fit to the nebular geometry is indicated by the green ellipse, which centre is offset 0”.2 from the binary nucleus. LINE OF SIGHT The Doppler shift of the barycentre of both the H and [NII] lines reveals an expansion pattern which is well fitted by a circumference of gas inclined ~63 and expanding at ~110 km/s. Note that the nucleus is Doppler shifted by 10 km/s with respect to the centre of expansion, a fact further supporting the offset between the binary nucleus and the ring nebula. The whole nebula was covered by the ARGUS IFU of the VLT+FLAMES at R=27000 and with a seeing of 0”.6. The [NII] and H profiles of 34 knots were analysed. Most of the line profiles are not symmetrical. Also, their Full Width at Zero Intensity is remarkably large (~150 km/s), i.e. of the same order of the gas expansion velocities. Fig. 4: Radial velocity of the barycentre of the [NII] lines vs. Position Angle. Fig. 3: Top: The nebula superimposed to the ARGUS IFU (green rectangle). The 34 regions analysed are marked as 0.6” diameter green circles. Bottom: The [NII]6548, H 6563 and [NII]6583 emission-line spectra for all the 300 ARGUS fibres. WHY ARE THE KNOTS’ LINE PROFILES SO BROADENED? • Summary • The nebular geometry and kinematics are well modeled by an inclined ring of gas expanding with a velocity of 110 km/s, but… • The binary nucleus is offset from the symmetry and expansion centres of the nebula. • The velocity broadening of both H and [NII] is of the order of the expansion velocity of the nebula, an effect possibly indicating the action of a front shock. Observing other emission lines might help supporting this hypothesis. • Any expansion-parallax estimation must take into account the possibility of an expanding shock. Hypothesis 1:A more complex geometry A ring-like distribution of gas extending to relatively high latitudes and spanning a significant range of expansion velocities might account for the line broadening near the minor axis, but not along the major axis where the nebula mainly expands in the plane of the sky. Hypothesis 3:Shocks A 170 km/s shock, passing through a partially ionised medium, may reproduce some of - but not all – the asymmetric line profiles, and would be consistent with the measured Vr of the gas. The FWZI of the profiles (Fig. 5) is consistent with the bow-shock models for H-H objects of Hartigan et al. (1987). Hypothesis 2:Knot self expansion Each individual knot would expand (i.e. part of the gas would accelerate and part would decelerate) in a significantly less dense medium, but it is not clear if this can produce the large velocity broadening observed. Fig. 5: FWZI of the H lines vs. P.A. Acknowledgements: The authors wish to thank B. Balick for his involvement in this work. In this case, the apparent expansion in the plane of the sky would not reflect gas motions, but rather the expansion of the shock front, with obvious implications in the derivation of a distance through the expansion-parallax method (see e.g. Mellema 2004). • References • Hartigan, P. et al., 1987, ApJ, 316, 323 • Mellema, G., 2004, A&A, 416, 623