Download
1 / 21
210 likes | 387 Views
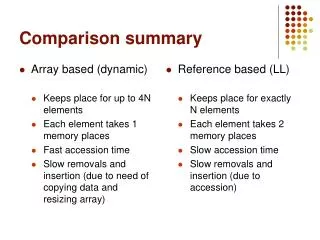
Consolidated Student Performance Comparison Summary. Subjectwise Comparison of Student Performance in Criterion-Referenced Competency Tests (CRCT). School Year. 2011-. 12. Student Performance Comparison by Race/Ethnicity.

E N D
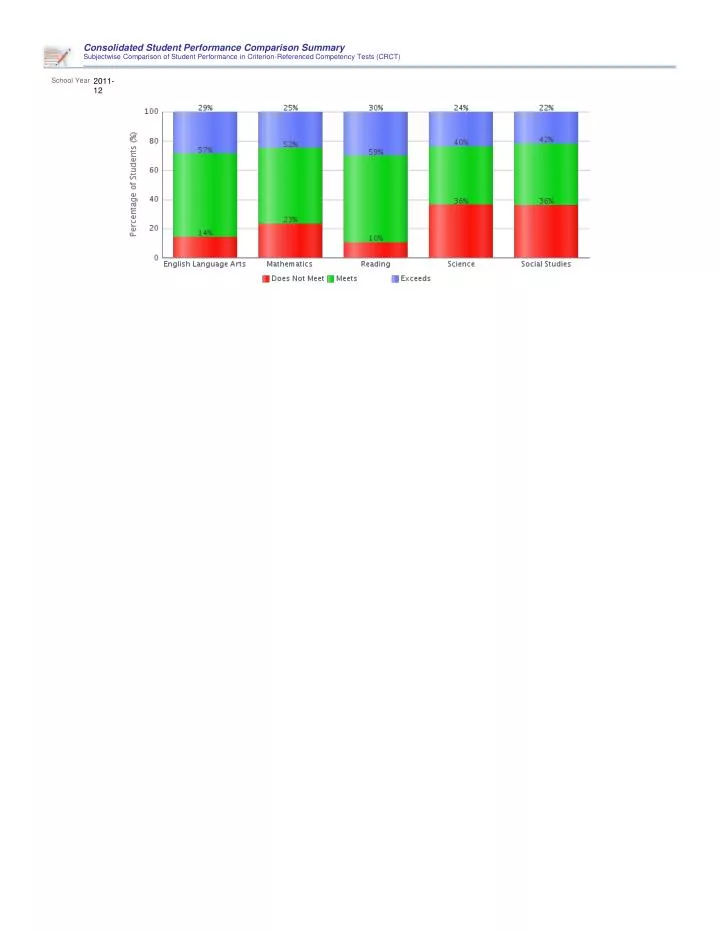
Consolidated Student Performance Comparison Summary Subjectwise Comparison of Student Performance in Criterion-Referenced Competency Tests (CRCT) School Year 2011- 12
Student Performance Comparison by Race/Ethnicity Performance of Students by Race/Ethnicity in Criterion-Referenced Competency Tests (CRCT) Race/Ethnicity White School Year 2011- 12
Student Performance Comparison by Race/Ethnicity Performance of Students by Race/Ethnicity in Criterion-Referenced Competency Tests (CRCT) Race/Ethnicity Asian School Year 2011- 12
Student Performance Comparison by Race/Ethnicity Performance of Students by Race/Ethnicity in Criterion-Referenced Competency Tests (CRCT) Race/Ethnicity Black School Year 2011- 12
Student Performance Comparison by Race/Ethnicity Performance of Students by Race/Ethnicity in Criterion-Referenced Competency Tests (CRCT) Race/Ethnicity Hispanic School Year 2011- 12
Students Performance Comparison by English Proficiency Performance of Students by English Proficiency Status in Criterion-Referenced Competency Tests (CRCT) English Proficiency Status Limited English Proficient School Year 2011- 12
Student Performance Comparison by Economic Status Performance of Students by their Economic Condition in Criterion-Referenced Competency Tests (CRCT) Economic Status Economically Disadvantaged School Year 2011- 12
Student Performance Comparison by Economic Status Performance of Students by their Economic Condition in Criterion-Referenced Competency Tests (CRCT) Economic Status Not Economically Disadvantaged School Year 2011- 12
Student Performance Comparison by Disability Status Performance of Students by Disability Status in Criterion-Referenced Competency Tests (CRCT) Disability Status Students with Disabilities School Year 2011- 12
DeKalb Certified Personnel Data Displays Category wise Metrics for Certified Personnel Administrators PK-12 Teachers Support Personnel 2011-12 Certificate Level 4 Yr Bachelor's 2 2,269 25 5 Yr Master's 153 3,329 464 6 Yr Specialist's 202 888 334 7 Yr Doctoral 137 202 106 Other * 1 24 0 Gender Male 173 1,510 109 Female 322 5,202 820 Personnel Full-time 486 6,295 896 Part-time 9 417 33 Positions Number 492 6,630 952 Average Annual Salary $88,012.06 $52,731.81 $62,040.65 Average Contract Days 220 187 193 Average Daily Salary $400.54 $282.43 $321.40 Race/Ethnicity Black 397 4,342 640 White 83 2,044 264 Hispanic 7 119 15 Asian 3 136 2 Native American 1 12 1 Multiracial 4 59 7 Years Experience < 1 3 465 47 1-10 15 2,722 202 11-20 238 2,178 372 21-30 163 1,000 222 > 30 76 347 86 Average 21 13 17 2012-13 Certificate Level 4 Yr Bachelor's 5 1,942 21 5 Yr Master's 165 3,104 372 6 Yr Specialist's 218 881 250 7 Yr Doctoral 126 216 99 Other * 0 27 0 Gender Male 156 1,400 81 Female 358 4,770 661 Personnel Full-time 513 5,750 710 Part-time 1 420 32 Positions Number 514 6,107 733 Average Annual Salary $83,589.88 $52,306.21 $60,867.57 Average Contract Days 213 185 189 Average Daily Salary $391.76 $283.31 $322.12 Race/Ethnicity Black 417 4,035 512 White 82 1,861 209 Hispanic 7 115 13 Asian 2 95 3 Native American 1 9 1 Multiracial 5 55 4 Years Experience < 1 6 151 31 1-10 16 2,566 166 11-20 239 2,138 293 21-30 196 1,006 176 > 30 57 309 76 Average 21 13 17 * Includes One- and Two-Year Vocational Certificates.
DeKalb Certificate Level 5 Yr Master's School Year 2011- 12
Gwinnett Certified Personnel Data Displays Category wise Metrics for Certified Personnel Administrators PK-12 Teachers Support Personnel 2011-12 Certificate Level 4 Yr Bachelor's 8 2,885 8 5 Yr Master's 184 5,208 275 6 Yr Specialist's 430 2,130 324 7 Yr Doctoral 131 264 46 Other * 0 6 0 Gender Male 217 1,916 74 Female 536 8,577 579 Personnel Full-time 669 10,078 593 Part-time 84 415 60 Positions Number 709 10,306 624 Average Annual Salary $86,541.54 $54,551.49 $62,650.82 Average Contract Days 213 190 195 Average Daily Salary $406.65 $287.11 $320.69 Race/Ethnicity Black 196 1,516 138 White 522 8,216 453 Hispanic 20 363 43 Asian 4 217 4 Native American 2 32 4 Multiracial 9 149 11 Years Experience < 1 5 344 8 1-10 66 4,308 229 11-20 369 3,762 239 21-30 210 1,595 128 > 30 103 484 49 Average 20 13 15 2012-13 Certificate Level 4 Yr Bachelor's 5 2,675 8 5 Yr Master's 181 5,042 276 6 Yr Specialist's 433 2,244 316 7 Yr Doctoral 128 277 46 Other * 0 5 0 Gender Male 225 1,862 64 Female 522 8,381 582 Personnel Full-time 687 9,834 595 Part-time 60 409 51 Positions Number 717 10,064 622 Average Annual Salary $85,896.03 $54,196.19 $61,677.59 Average Contract Days 213 190 195 Average Daily Salary $403.04 $285.24 $315.55 Race/Ethnicity Black 204 1,503 140 White 503 7,975 441 Hispanic 22 365 44 Asian 6 228 5 Native American 2 34 4 Multiracial 10 138 12 Years Experience < 1 1 342 17 1-10 71 3,989 208 11-20 385 3,863 256 21-30 191 1,588 121 > 30 99 461 44 Average 20 14 15 * Includes One- and Two-Year Vocational Certificates.
Gwinnett Certificate Level 5 Yr Master's School Year 2011- 12
Cobb Certified Personnel Data Displays Category wise Metrics for Certified Personnel Administrators PK-12 Teachers Support Personnel 2011-12 Certificate Level 4 Yr Bachelor's 3 2,726 76 5 Yr Master's 139 3,514 500 6 Yr Specialist's 234 1,040 307 7 Yr Doctoral 68 136 71 Other * 0 28 0 Gender Male 131 1,359 66 Female 313 6,085 888 Personnel Full-time 423 7,279 879 Part-time 21 165 75 Positions Number 433 7,374 920 Average Annual Salary $82,708.25 $53,769.86 $58,076.77 Average Contract Days 219 187 192 Average Daily Salary $377.48 $287.28 $302.06 Race/Ethnicity Black 111 1,235 185 White 321 5,829 726 Hispanic 10 205 21 Asian 2 84 7 Native American 0 16 2 Multiracial 0 75 13 Years Experience < 1 11 381 90 1-10 34 3,301 311 11-20 203 2,483 329 21-30 140 1,010 160 > 30 56 269 64 Average 20 12 14 2012-13 Certificate Level 4 Yr Bachelor's 1 2,589 119 5 Yr Master's 140 3,364 496 6 Yr Specialist's 217 1,063 304 7 Yr Doctoral 87 142 70 Other * 0 29 0 Gender Male 131 1,313 71 Female 314 5,874 918 Personnel Full-time 423 7,011 901 Part-time 22 176 88 Positions Number 438 7,125 951 Average Annual Salary $83,408.81 $54,322.67 $56,200.59 Average Contract Days 220 188 192 Average Daily Salary $378.54 $288.73 $293.26 Race/Ethnicity Black 110 1,198 179 White 320 5,607 762 Hispanic 11 206 27 Asian 2 78 6 Native American 1 23 0 Multiracial 1 75 15 Years Experience < 1 12 365 126 1-10 33 3,004 299 11-20 211 2,569 348 21-30 136 1,001 155 > 30 53 248 61 Average 20 12 13 * Includes One- and Two-Year Vocational Certificates.
Cobb Certificate Level 5 Yr Master's School Year 2011- 12
Clayton Certified Personnel Data Displays Category wise Metrics for Certified Personnel Administrators PK-12 Teachers Support Personnel 2011-12 Certificate Level 4 Yr Bachelor's 1 1,007 1 5 Yr Master's 81 1,505 117 6 Yr Specialist's 88 596 97 7 Yr Doctoral 54 77 32 Other * 0 12 0 Gender Male 80 659 31 Female 144 2,538 216 Personnel Full-time 224 3,197 246 Part-time 0 0 1 Positions Number 224 3,206 247 Average Annual Salary $82,403.53 $51,522.60 $63,415.39 Average Contract Days 218 185 196 Average Daily Salary $377.97 $278.59 $323.82 Race/Ethnicity Black 169 2,209 170 White 49 769 65 Hispanic 2 92 6 Asian 1 43 0 Native American 0 9 1 Multiracial 3 75 5 Years Experience < 1 0 175 3 1-10 33 1,572 78 11-20 119 973 105 21-30 52 349 40 > 30 20 128 21 Average 18 12 15 2012-13 Certificate Level 4 Yr Bachelor's 2 858 0 5 Yr Master's 89 1,374 120 6 Yr Specialist's 105 598 104 7 Yr Doctoral 61 73 25 Other * 0 8 0 Gender Male 72 615 36 Female 185 2,296 213 Personnel Full-time 257 2,911 249 Part-time 0 0 0 Positions Number 257 2,912 249 Average Annual Salary $77,927.09 $51,564.13 $61,646.50 Average Contract Days 214 185 196 Average Daily Salary $364.46 $278.72 $315.05 Race/Ethnicity Black 201 2,057 185 White 47 668 55 Hispanic 2 84 4 Asian 2 39 0 Native American 0 8 1 Multiracial 5 55 4 Years Experience < 1 0 153 13 1-10 52 1,311 74 11-20 130 1,012 107 21-30 57 320 37 > 30 18 115 18 Average 17 12 15 * Includes One- and Two-Year Vocational Certificates.
Clayton Certificate Level 5 Yr Master's School Year 2011- 12
Fulton Certified Personnel Data Displays Category wise Metrics for Certified Personnel Administrators PK-12 Teachers Support Personnel 2011-12 Certificate Level 4 Yr Bachelor's 10 1,208 9 5 Yr Master's 178 1,582 163 6 Yr Specialist's 163 645 105 7 Yr Doctoral 91 148 37 Other * 0 13 0 Gender Male 130 825 48 Female 312 2,771 266 Personnel Full-time 439 3,589 311 Part-time 3 7 3 Positions Number 441 3,593 313 Average Annual Salary $87,348.69 $59,135.22 $67,115.06 Average Contract Days 223 192 200 Average Daily Salary $391.99 $308.77 $335.97 Race/Ethnicity Black 390 2,646 277 White 49 794 33 Hispanic 1 94 4 Asian 2 54 0 Native American 0 7 0 Multiracial 0 1 0 Years Experience < 1 5 307 6 1-10 134 1,697 92 11-20 200 1,023 111 21-30 66 425 66 > 30 37 144 39 Average 15 11 16 2012-13 Certificate Level 4 Yr Bachelor's 10 1,150 8 5 Yr Master's 184 1,616 152 6 Yr Specialist's 202 665 114 7 Yr Doctoral 104 151 38 Other * 0 14 0 Gender Male 161 824 49 Female 339 2,772 263 Personnel Full-time 498 3,586 310 Part-time 2 10 2 Positions Number 499 3,592 311 Average Annual Salary $87,739.98 $59,034.39 $72,798.22 Average Contract Days 222 192 201 Average Daily Salary $394.44 $307.74 $361.95 Race/Ethnicity Black 435 2,650 268 White 61 805 40 Hispanic 1 86 4 Asian 2 46 0 Native American 1 9 0 Multiracial 0 0 0 Years Experience < 1 37 440 14 1-10 153 1,499 79 11-20 211 1,128 115 21-30 70 411 67 > 30 29 118 37 Average 14 11 16 * Includes One- and Two-Year Vocational Certificates.
Fulton Certificate Level 5 Yr Master's School Year 2011- 12
Atlanta Certified Personnel Data Displays Category wise Metrics for Certified Personnel Administrators PK-12 Teachers Support Personnel 2011-12 Certificate Level 4 Yr Bachelor's 313 2,419 251 5 Yr Master's 723 3,043 682 6 Yr Specialist's 301 592 264 7 Yr Doctoral 72 90 37 Other * 3 13 6 Gender Male 319 1,163 403 Female 1,093 4,994 837 Personnel Full-time 349 5,587 615 Part-time 1,063 570 625 Positions Number 448 6,087 739 Average Annual Salary $82,339.91 $51,419.45 $59,084.10 Average Contract Days 216 190 190 Average Daily Salary $381.48 $270.91 $310.75 Race/Ethnicity Black 588 2,135 435 White 787 3,758 768 Hispanic 17 139 22 Asian 15 105 13 Native American 3 17 1 Multiracial 2 3 1 Years Experience < 1 27 481 113 1-10 541 3,058 532 11-20 565 1,764 387 21-30 215 675 156 > 30 64 179 52 Average 14 11 12 2012-13 Certificate Level 4 Yr Bachelor's 340 2,424 281 5 Yr Master's 806 3,135 766 6 Yr Specialist's 308 652 272 7 Yr Doctoral 85 90 42 Other * 1 12 3 Gender Male 326 1,214 430 Female 1,214 5,099 934 Personnel Full-time 364 5,656 707 Part-time 1,176 657 657 Positions Number 465 6,225 839 Average Annual Salary $80,960.73 $50,638.31 $58,130.25 Average Contract Days 217 190 190 Average Daily Salary $372.59 $266.66 $305.34 Race/Ethnicity Black 599 2,193 480 White 889 3,830 849 Hispanic 25 155 22 Asian 21 112 10 Native American 2 12 1 Multiracial 4 11 2 Years Experience < 1 61 750 159 1-10 594 2,970 586 11-20 613 1,783 416 21-30 214 662 150 > 30 58 148 53 Average 13 10 11 * Includes One- and Two-Year Vocational Certificates.
Atlanta Certificate Level 5 Yr Master's School Year 2011- 12