Download
1 / 39
420 likes | 689 Views
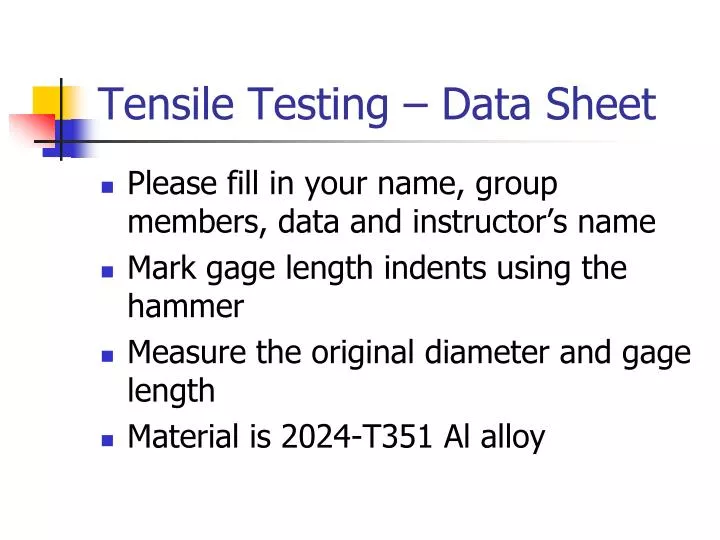
Tensile Testing – Data Sheet. Please fill in your name, group members, data and instructor’s name Mark gage length indents using the hammer Measure the original diameter and gage length Material is 2024-T351 Al alloy. Today’s Specimen. 2024-T351 Aluminum Alloy

E N D
Tensile Testing – Data Sheet • Please fill in your name, group members, data and instructor’s name • Mark gage length indents using the hammer • Measure the original diameter and gage length • Material is 2024-T351 Al alloy
Today’s Specimen • 2024-T351 Aluminum Alloy • Contains ~94% (Al), ~4.5%(Cu), 1.5% (Mg) • Used in aircraft fittings, gears and shafts, missile parts, veterinary and orthopedic equipment • You can use info for 2024-T3 for comparison
After Testing • Record load & strain when extensometer was taken off • Record maximum load and approximate load at yield • Measure final diameter and gage length • Record data filename • Either sketch or photograph the fractured surfaces • Compute the parameters on the reverse side of data sheet
Lab Report #2: due next week • Cover Page + Abstract (10 points) • Data Sheet (5 points) • Spreadsheet of Raw/Processed Data • Relevant Plots (20 points) • Materials Properties Table (5 points) • Comments and Conclusions (15 points)
Tensile Properties • Quantitative determination of • Elastic Modulus, E • Proportional Limit, PL • 0.2% Offset Yield Strength, Y • Tensile Strength, TS • % Elongation to Failure, %f • Modulus of Toughness, Atotal • Qualitative study of Failure
Tensile Testing –Processing Data • Importing data into Excel • Correcting data for physical slack • Setting up the spreadsheet • Computing stresses and strains • Entire stress-strain curve • Elastic portion and modulus • Proportional limit and yield strength • Modulus of Toughness • Fitting spreadsheet into one page • Lab Report Template
Importing Data into Excel • In Excel: File Open (choose file) • Dialog: Do you want to open the file now? click on “Yes” button • Steps 1-3: click Next Next Finish
Correcting data for initial slack • Identify a row when both strain and force increase monotonically (in our case row 550) : see next two slides {it may help to plot the data up to ~2000lb} • Subtract this initial strain and force value from each subsequent row (in our case: 0=2.05E-02%, F0=1.05E+03 lb) • See next two slides
Identifying the New Origin Strain = 2.05E-02 Force = 1.50E+03
Correcting Raw Data =A550-$A$550 =B550-$B$550 0 decimal digits 3 decimal digits
Format Data and Plots • Load in lbs - 1 decimal digit • Strain in % - 3 decimal digits • Stress in psi – 0 decimal digits • Strain in in/in – 2 decimal digits (sci notation) • Energy in psi - 2 decimal digits (sci notation) • Format one row; then COPY + PASTE SPECIAL (format only) to other rows • Check axis scales in all the plots • Print the plots before hiding rows
Spreadsheet Setup • In a New Worksheet • Set up cells as shown below A0 = D02/4 Af = Df2/4
Compute Stresses & Strains • Copy & Paste Special (Values & Formats only) “corrected” data • Compute stress & strain for first row =Load/A0 0 dec digits = Ln(1 + ) 2 dd sci =%strain/100 2 dd sci = (1 + ) 0 dec digits
Stresses & Strains • Format strain cells (scientific, 2 decimals) • Format stress cells (number, 0 decimal) • Copy formulas for each subsequent row • {Note true stress & strain formulas are valid only up to the maximum load}
Plot Stress-Strain Curves • Select data in columns C, D, E & F • Plot smooth curves (no data markers) • Move the chart to a new worksheet • Delete gridlines • Adjust True Stress curve so that it is plotted against data in column E (see next slide) • Adjust axis titles and values (see the plot)
Adjusting True Stress Curve • Right Click on plot Select Data…
Adjusting True Stress Curve • Replace “C” by “E” in “Series X Values” box
Elastic Modulus • Select data in columns C & D up to a stress value that shows linearity • Plot data markers • Move chart to a new worksheet • Delete gridlines • Fit a straight line thru’ the origin • Format the plot labels, axes and line-fit results as appropriate (see next slide)
Elastic Modulus Plot • Enter E = 29.60 Msi in cell I5 Select data points by clicking on any and then Right-click and choose “Add Trendline”
Proportional Limit and0.2% Offset Yield Strength • In column H, enter formula: = E * Engg Strain • Adjust format, and copy it down until the stress value slightly exceeds Engg Stress • In column G, beginning at row where Engg Strain slightly exceeds 0.002 (-0.2%), enter formula: = E * (Engg Strain – 0.002) • Adjust format, and copy it down until the stress value slightly exceeds Engg stress
Proportional Limit and Yield Strength Elastic Modulus, Em Begin at Estrain = 0.002 = Em * EStrain = Em * (Estrain – 0.002) Stop 69702 > 64779 Stop 78643 > 75792
Plot Curve & Lines • Plot data in columns C, D, G, H (smooth curves, no data markers) • Format plot labels, axes etc. (see next slide)
Data Point @ failure same
Modulus of Toughnessusing Trapezoidal Rule • {Note no entry in Row 13} • Enter formula for width: =C14 – C13 • Enter formula for average height: = (D14 + D13)/2 • Enter formula for area: = I14 * J14 • Adjust formats, and copy all formulas down to the last row (point@failure) • Modulus of Toughness is the sum of all area values (see next slide)
Modulus of Toughnessusing Trapezoidal Rule = C14 – C13 2 dd sci = (D14 + D13)/2 0 dec digits =I14 * J14 2 dd sci
Materials Property Tables Triangular Area
Format Data and Plots • Load in lbs - 1 decimal digit • Strain in % - 3 decimal digits • Stress in psi – 0 decimal digits • Strain in in/in – 2 decimal digits (sci notation) • Energy in psi - 2 decimal digits (sci notation) • Format one row; then COPY + PASTE SPECIAL (format only) to other rows • Check axis scales in all the plots • Print the plots before hiding rows
Lab Report due next week • {note that when you hide rows, it may distort your plots} • Answer multiple-choice questions and student survey ONLINE before the due-date • Review your lab report before submitting in the box under your mailfolders • Select box “MECE-204: Strength Lab”