Download
1 / 49
490 likes | 624 Views
Total Student Aid and Nonfederal Loans Used to Finance Postsecondary Education Expenses in 2011 Dollars (in Millions), 2001-02 to 2011-12. SOURCE: The College Board, Trends in Student Aid 2012, Table 1.

E N D
Total Student Aid and Nonfederal Loans Used to Finance Postsecondary Education Expenses in 2011 Dollars (in Millions), 2001-02 to 2011-12 SOURCE: The College Board, Trends in Student Aid 2012, Table 1.
Ten-Year Trend in Student Aid and Nonfederal Loans per Full-Time Equivalent (FTE) Student Used to Finance Postsecondary Education Expenses in 2011 Dollars, 2001-02 to 2011-12 SOURCE: The College Board, Trends in Student Aid 2012, Figure 1.
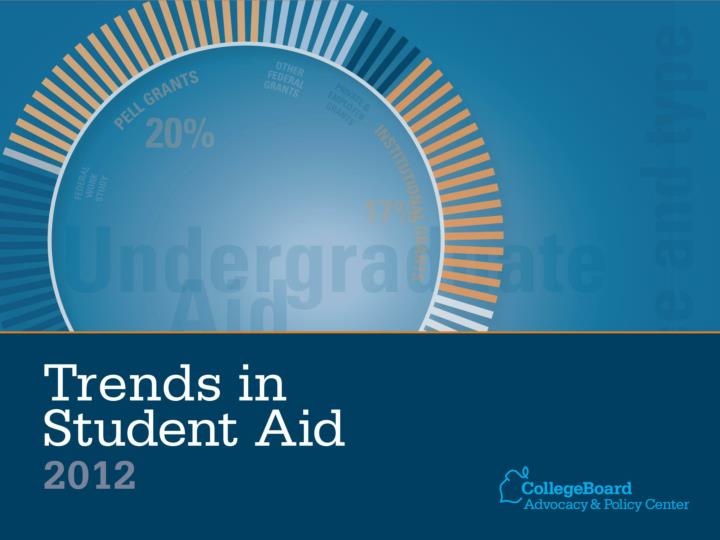
Undergraduate Student Aid by Source and Type (in Billions), 2011-12 SOURCE: The College Board, Trends in Student Aid 2012, Figure 2A.
Total Student Aid and Funds Used to Finance the Postsecondary Education Expenses of Undergraduates in 2011 Dollars (in Millions), 1991-92 to 2011-12 (Selected Years) SOURCE: The College Board, Trends in Student Aid 2012, Table 1A.
Graduate Student Aid by Source and Type (in Billions), 2011-12 SOURCE: The College Board, Trends in Student Aid 2012, Figure 2B.
Total Student Aid and Funds Used to Finance the Postsecondary Education Expenses of Graduate Students in 2011 Dollars (in Millions), 1991-92 to 2011-12 (Selected Years) SOURCE: The College Board, Trends in Student Aid 2012, Table 1B.
Average Aid per Full-Time Equivalent (FTE) Undergraduate Student in 2011 Dollars, 1996-97 to 2011-12 SOURCE: The College Board, Trends in Student Aid 2012, Figure 3A.
Average Aid per Full-Time Equivalent (FTE) Graduate Student in 2011 Dollars, 1996-97 to 2011-12 SOURCE: The College Board, Trends in Student Aid 2012, Figure 3B.
Grants and Loans as a Percentage of Funds from Total Aid and Nonfederal Loans for Undergraduate Students, 1991-92 to 2011-12 SOURCE: The College Board, Trends in Student Aid 2012, Figure 4A.
Grants and Loans as a Percentage of Funds from Total Aid and Nonfederal Loans for Graduate Students, 1991-92 to 2011-12 SOURCE: The College Board, Trends in Student Aid 2012, Figure 4B.
Growth of Federal, Institutional, Private and Employer, and State Grant Dollars in 2011 Dollars, 1991-92 to 2011-12 SOURCE: The College Board, Trends in Student Aid 2012, Figure 5.
Growth of Federal and Nonfederal Loan Dollars in 2011 Dollars, 1991-92 to 2011-12, Selected Years SOURCE: The College Board, Trends in Student Aid 2012, Figure 6.
Number of Recipients by Federal Aid Program (with Average Aid Received), 2011-12 SOURCE: The College Board, Trends in Student Aid 2012, Figure 7A.
Total Number of Stafford Loan Borrowers and Average Amount Borrowed, 2001-02 to 2011-12 SOURCE: The College Board, Trends in Student Aid 2012, Figure 7B.
Percentage Distribution of Federal Aid Funds by Sector, 2011-12 SOURCE: The College Board, Trends in Student Aid 2012, Figure 8A.
Percentage Distribution of Pell Grant Funds and Stafford Loan Funds by Sector, 1991-92 to 2011-12 SOURCE: The College Board, Trends in Student Aid 2012, Figure 8B.
Total FTE Enrollments by Sector, Fall 1991 to 2011 SOURCE: The College Board, Trends in Student Aid 2012, Figure 8A table.
Federal Student Loan Two-Year Cohort Default Rate (CDR), 1987–2010 SOURCE: The College Board, Trends in Student Aid 2012, Figure 9A.
Two-Year Cohort Default Rate by Sector, 2000, 2009 and 2010, and Three-Year Cohort Default Rate by Sector, 2009 SOURCE: The College Board, Trends in Student Aid 2012, Figure 9B.
Distribution of Total Enrollment, Borrowers Entering Repayment, and Defaulters (2-Year and 3-Year) by Sector SOURCE: The College Board, Trends in Student Aid 2012, Figure 9A table.
Percentage of Undergraduate Students Borrowing Federal Stafford Loans, 2001-02, 2006-07, and 2011-12 SOURCE: The College Board, Trends in Student Aid 2012, Figure 10A.
Average Total Student Loans per Full-Time Equivalent (FTE) Undergraduate and Graduate Student in 2011 Dollars, 2001-02 to 2011-12 SOURCE: The College Board, Trends in Student Aid 2012, Figure 10B.
Educational Attainment by 2009 of Students First Enrolling in 2003-04, by Total Amount Borrowed (and Overall Percentage of Students in Debt Category) SOURCE: The College Board, Trends in Student Aid 2012, Figure 11A.
Sector Last Attended, as of 2009, Among Bachelor’s Degree Recipients Who First Enrolled in 2003-04, by Total Amount Borrowed (and Overall Percentage of Students in Debt Category) SOURCE: The College Board, Trends in Student Aid 2012, Figure 11B.
Amount Borrowed by Students Who First Enrolled in 2003-04 and Left Without Completing a Degree or Certificate by 2009, by Institutional Sector and Length of Enrollment (with Percentages of Students in Each Sector Within Enrollment Category) SOURCE: The College Board, Trends in Student Aid 2012, Figure 11C.
Average Total Debt Levels of Bachelor’s Degree Recipients, Public Four-Year Colleges and Universities, in 2011 Dollars, 1999-2000 to 2010-11 SOURCE: The College Board, Trends in Student Aid 2012, Figure 12A.
Average Total Debt Levels of Bachelor’s Degree Recipients, Private Nonprofit Four-Year Colleges and Universities, in 2011 Dollars, 1999-2000 to 2010-11 SOURCE: The College Board, Trends in Student Aid 2012, Figure 12B.
Number of Pell Recipients, Total Inflation-Adjusted Expenditures, and Maximum and Average Pell Grant Relative to 1976-77 Level, 1976-77 to 2011-12 SOURCE: The College Board, Trends in Student Aid 2012, Figure 13A.
Maximum and Average Pell Grant in 2011 Dollars, 1976-77 to 2011-12 SOURCE: The College Board, Trends in Student Aid 2012, Figure 13B.
Federal Pell Grant Awards in 2011 Dollars, 1976-77 to 2011-12, Selected Years SOURCE: The College Board, Trends in Student Aid 2012, Figure 13A table.
Total Undergraduate Enrollment and Percentage of Students Receiving Pell Grants, 2001-02 to 2011-12 SOURCE: The College Board, Trends in Student Aid 2012, Figure 14A.
Inflation-Adjusted Maximum Pell Grant, Tuition and Fees (TF), Tuition and Fees and Room and Board (TFRB), and Maximum Pell Grant as a Percentage of TF and TFRB, 1992-93 to 2012-13 SOURCE: The College Board, Trends in Student Aid 2012, Figure 14B.
Distribution of Pell Grant Recipients (in Thousands) by Dependency Status, Enrollment Intensity, and Institutional Sector, 2010-11 SOURCE: The College Board, Trends in Student Aid 2012, Figure 15A.
Distribution of Pell Grant Recipients by Dependency Status and Income Level, 2010‑11 SOURCE: The College Board, Trends in Student Aid 2012, Figure 15B.
Distribution of Pell Grant Recipients by Dependency Status and Income Level, 2010‑11 SOURCE: The College Board, Trends in Student Aid 2012, Figure 15B.
Distribution of Pell Grant Recipients by Age, 2010‑11 SOURCE: The College Board, Trends in Student Aid 2012, Figure 15C.
Total Education Tax Credits and Tuition Deductions in 2011 Dollars, 1998 to 2010 (and Average Tax Savings per Recipient) SOURCE: The College Board, Trends in Student Aid 2012, Figure 16A.
Distribution of Education Tax Credits by Adjusted Gross Income (AGI), 2010 (and Average Tax Savings per Recipient in 2011 Dollars) Distribution of Savings from Tuition Tax Deductions by Adjusted Gross Income (AGI), 2010 (and Average Tax Savings per Recipient in 2011 Dollars) SOURCE: The College Board, Trends in Student Aid 2012, Figure 16B and Figure 16C.
Need-Based and Non-Need-Based State Grants per Full-Time Equivalent (FTE) Undergraduate Student in 2011 Dollars, 1970-71 to 2010-11 SOURCE: The College Board, Trends in Student Aid 2012, Figure 17A.
Percentage of Undergraduate State Grant Aid for Which Students’ Financial Circumstances Were Considered, by State, 2010-11 SOURCE: The College Board, Trends in Student Aid 2012, Figure 17B.
State Grant Aid per Full-Time Equivalent (FTE) Undergraduate Student in 2011 Dollars, 2010-11 SOURCE: The College Board, Trends in Student Aid 2012, Figure 18A.
State Grant Expenditures as a Percentage of Total State Support for Higher Education, 2010-11 SOURCE: The College Board, Trends in Student Aid 2012, Figure 18B.
Institutional Grant Aid per Full-Time Equivalent (FTE) Student by Institutional Selectivity and Student Financial Need, Public Four-Year Colleges and Universities, in 2011 Dollars, 2007-08 to 2011-12 SOURCE: The College Board, Trends in Student Aid 2012, Figure 19A.
Institutional Grant Aid per Full-Time Equivalent (FTE) Student by Institutional Selectivity and Student Financial Need, Private Nonprofit Four-Year Colleges and Universities, in 2011 Dollars, 2007-08 to 2011-12 SOURCE: The College Board, Trends in Student Aid 2012, Figure 19B.
Total Assets in State-Sponsored Section 529 Savings Plans (and Percentage of Funds in Prepaid Tuition Accounts) in 2012 Dollars (in Billions), December 1999 to June 2012 SOURCE: The College Board, Trends in Student Aid 2012, Figure 20A.
Number of State-Sponsored 529 Savings Accounts (and Average Account Value in 2012 Dollars), 2001–2012 SOURCE: The College Board, Trends in Student Aid 2012, Figure 20B.
State-Sponsored 529 College Savings Accounts: Contributions and Distributions, in 2012 Dollars (in Billions), 2009 to 2011 SOURCE: The College Board, Trends in Student Aid 2012, Figure 20C.
For more information, visit:trends.collegeboard.orgSandy Baum, sbaum@skidmore.eduJennifer Ma, jma@collegeboard.orgKathleen Payea, kpayea@collegeboard.org