Download
1 / 13
130 likes | 241 Views
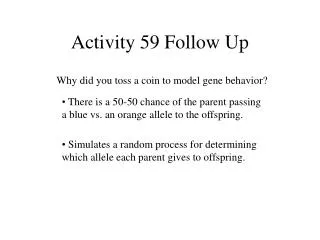
Activity 38 Follow-up:. Based on your observation in Activities 37 & 38, what do you think determines how much of a substance dissolves? The identity of the solvent and solute determine whether some dissolving is going to occur.

E N D
Activity 38 Follow-up: • Based on your observation in Activities 37 & 38, what do you think determines how much of a substance dissolves? • The identity of the solvent and solute determine whether some dissolving is going to occur. • How much dissolves or whether the solution becomes saturated depends on the relative amounts of solvent & solute.
Signs of a chemical reaction: • Color change (of a solution) • Energy change (temperature change, light, or generation of electricity) • Odor change • Disappearance of an original substance (reactant consumption) • Formation of bubbles (gaseous product) • Formation of a precipitate (solid product) • Change in the results of a chemical test (such as a pH change detected with an indicator)
Reactants and Products • Reactants Products • Reactants go into the reaction • Products come out of the reaction
Read C-78 • Challenge Question: How can you use a chemical reaction to remove a contaminant from a solution?
Procedure: Step 1: Create Liquid following chart into SEPUP Cup A Step 2: Record Observations Step 3: Filter solution through filter paper Step 4: Wait until all liquid goes through filter paper. Step 5: Record observations Filter paper (What do you see on paper?) Filtrate (liquid that went through)
Step 6: Test Filtrate (Add 10 drops of Sodium Carbonate If something happened, does filtration method work?) Step 7: Record Observations of Filtrate 1 Drop – (what happened?) 2 Drops – (What happened?) 3 Drops – (What happened?) … Repeat for the other three liquids…
Student Sheet 45.1,“A Precipitation Reaction” • Filter paper - fold and moisten with water • Test 1 = Cup A, Test 2 = Cup B, etc. • Test of Filtrate: Added 10 drops of sodium carbonate one at a time • Filtrate: liquid that leaks down
Results • Test 1:Not all contaminant has precipitated because there is blue solution remaining around the edges of the precipitate. • Test 2:Not all contaminant has precipitated, but more than Test 1. • Test 3:Not all contaminant has precipitated, but more than Test 2. • Test 4:All of the contaminant has precipitated because there is no blue solution remaining; there is only solid blue precipitate present.
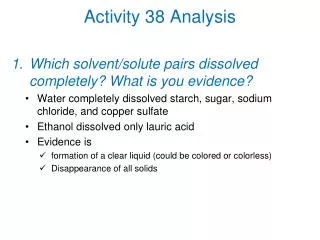
Analysis Question #1 • What was the contaminant in this activity? • Copper Chloride
Analysis Question #2 • What evidence indicates that a chemical reaction occurred when you mixed solutions of sodium carbonate and copper chloride? • There is a color change and the appearance of a new solid material or precipitate.
Analysis Question #3 • Where did the solid that appeared come from? • It is a precipitate formed in a chemical reaction. b. Why does the precipitate get stuck in the paper? • It is an undissolved solid. It is insoluble. c. What properties do all solid precipitates that settled to the bottom when two solutions are mixed have? • Slightly soluble in the surrounding liquid (they appear as solids and do not remain dissolved). • The solids settle to the bottom which indicates that they must be more dense than the liquid.
Analysis Question #4 • Describe two ways the control in Test 1 helped you analyze the data. • It was used for comparison to help determine if all of the contaminant had precipitated out.