Download
1 / 40
400 likes | 503 Views
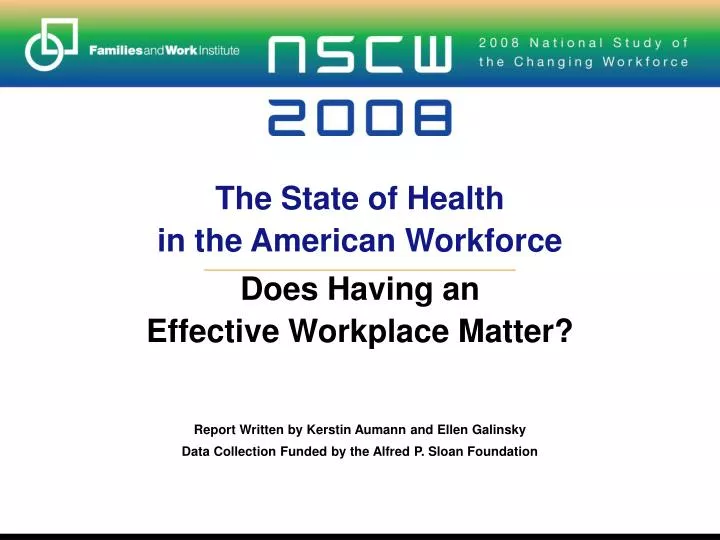
The State of Health in the American Workforce Does Having an Effective Workplace Matter? Report Written by Kerstin Aumann and Ellen Galinsky Data Collection Funded by the Alfred P. Sloan Foundation. PART ONE: What is the State of Health in the American Workforce?.

E N D
The State of Healthin the American Workforce Does Having an Effective Workplace Matter? Report Written by Kerstin Aumann and Ellen Galinsky Data Collection Funded by the Alfred P. Sloan Foundation
PART ONE: What is the State of Health in the American Workforce?
FINDING: 28% employees in 2008 say their overall health is “excellent” — a significant decline of 6% since 2002 Employees’ self-assessment of their current state of overall health } *** Source: Families and Work Institute. 2002 NSCW (N=2,810), 2008 NSCW (N=2,764). Statistically significant changes between survey years are denoted as * (p<.05), ** (p<.01), *** (p<.001), n.s. (not statistically significant).
FINDING: Fewer employees never experience minor health problems — such as headaches, upset stomachs or insomnia — in 2008 (29%) than in 2002 (36%) Frequency of minor health problems in last month } ** Source: Families and Work Institute. 2002 NSCW (N=2,803), 2008 NSCW (N=2,768). Statistically significant changes between survey years are denoted as * (p<.05), ** (p<.01), *** (p<.001), n.s. (not statistically significant).
FINDING: Just more than one in five employees is currently receiving treatment for high blood pressure Percentage of employees who currently receive treatment for… Source: 2008 NSCW
FINDINGS: A closer look at the lifestyles of American employees reveals that there is room for improvement • Despite widespread efforts to reduce smoking and the pervasiveness of strict non-smoking policies in American workplaces, one in four employees still smokes • Nearly half of U.S. employees (49%) have not engaged in regular physical exercise in the last 30 days On how many different occasions did you do vigorous physical exercise during the past 30 days?
FINDING: Nearly two out of three employed individuals (62%) are overweight or obese, up from 57% in 2002 Body Mass Index categories of employed adults age 18 and older } n.s. Source: 2002, 2008 NSCW; statistically significant differences between sample years are denoted as * (p<.05), ** (p<.01), *** (p<.001), n.s. (not statistically significant)
FINDING: One third of the workforce shows signs of clinical depression Number of signs of clinical depression } n.s. Source: 2002, 2008 NSCW; statistically significant differences between sample years are denoted as * (p<.05), ** (p<.01), *** (p<.001), n.s. (not statistically significant)
FINDING: 28% of the American workforce have sleep problems at least sometimes Frequency of sleep problems affecting job performance in last month } n.s. Source: 2002, 2008 NSCW; statistically significant differences between sample years are denoted as * (p<.05), ** (p<.01), *** (p<.001), n.s. (not statistically significant)
FINDING: Sleep problems include trouble falling asleep and awakening too soon • One in five employees (20%) very often or fairly often has trouble falling asleep. Another 22% sometimes have trouble falling asleep. Only one third (34%) reports never having had trouble falling asleep in the last month • Nearly one third (31%) of employees reports awakening too soon and having trouble going back to sleep very often or fairly often with another 27% reporting sometimes. Just more than one in five (21%) employees has never experienced awakening too soon in the last month
FINDING: Stress levels are rising The National Study of the Changing Workforce includes a five-item standardized measure of perceived stress that has been linked to physical health problems in other research. The questions are: In the last month, how often have you felt… • nervous and stressed? • that you were unable to control the important things in your life? • confident about your ability to handle your personal problems? • that things were going your way? • that difficulties were piling up so high that you could not overcome them? 41% of employees report experiencing three or more indicators of stress sometimes, often or very often — an increase since 2002
PART TWO: What Demographic Characteristics Make a Difference?
FINDINGS: Significant differences in employee health in 2008 exist not only across age groups, but also across other demographic characteristics Demographics characteristics predicting more positive health outcomes in 2008 Source: Families and Work Institute. 2008 NSCW (N=2,231 to 2,736). Only significant relationships are depicted.
FINDING: The downward trend in employee health over the last six years cannot be explained by age — other factors make a difference The health of older employees (age 30 and older) has not changed more than that of their younger colleagues (under 30) — while employees of other demographic groups have experienced significant declines over this time period
FINDING: Men have experienced more significant declines in the last six years than women As a result, the gap between men and women is narrowing with respect to their physical and mental health and well-being
FINDING: Middle- and high-wage and –income employees fare significantly better in mental health than low-wage/low-income employees This gap is decreasing as trends in mental health converge across income levels
PART THREE: How Do Workplace Policies and Benefits Impact Employee Health?
FINDINGS: While, 84% of U.S. employees have access to health insurance offered by their employers, nearly two thirds (66%) of U.S. employees are enrolled in their employer’s health plan • Among those enrolled, 23% have the plan paid for entirely by their employer • 74% have the plan partly paid for by their employer • 4% of employees have no employer contribution • 26% of U.S. employees have health insurance from another source (e.g., a spouse’s employer), regardless of availability of health insurance through their jobs
FINDING: 2008 NSCW data indicate that 8% of employees are not enrolled in health insurance regardless of its availability from their employer or from another source According to the U.S. Census Bureau, 46.3 million Americans, or 15% of the population, are without health insurance Further, the U.S. Census Bureau reports that the number of individuals covered by employer health insurance has declined from 177.4 million in 2007 to 176.3 million in 2008
FINDINGS: Low-wage/low-income employees are less likely to have access or to enroll in their employers’ health insurance
FINDING: Having employers contribute financially makes a difference • Among employees with access to health insurance through their job, 91% of employees whose employer pays for the plan entirely are enrolled, compared with 80% of those whose employers pay partly and 51% of those whose employers do not contribute at all • Among low-wage/low-income employees with access to employer health insurance, only 34% of those who do not receive any employer contribution are enrolled in their employer health plan, compared with 57% of mid- and high-wage and –income employees
FINDING: Overall, 24% of low-wage/low-income employees have no health care insurance from their employers or from another source –– compared with 5% of middle-and high-wage and –income employees
FINDING: Employees who are enrolled in health insurance through their employer or from another source are significantly less likely to plan to seek another job and report better physical and mental health Relationships between health insurance enrollment and positive outcomes Source: Families and Work Institute. 2008 NSCW (N=2,370 to 2,768); statistically significant differences are denoted as * (p<.05), ** (p<.01), *** (p<.001), n.s. (not statistically significant).
FINDING: 63% of American employees receive at least five paid days off per year for personal illness • Low-wage/low-income employees are much less likely to receive at least five paid sick days — only 46% do — compared with 66% of middle- and high-wage and –income employees
FINDING: Employees who receive at least five paid days off per year for personal illness report significantly better work and health and well-being outcomes Relationships between paid sick days and positive outcomes Source: Families and Work Institute. 2008 NSCW (N=2,320 to 2,710); statistically significant differences are denoted as * (p<.05), ** (p<.01), *** (p<.001), n.s. (not statistically significant).
FINDING: 79% of American employees receive paid vacation time • American employees receive an average of 16 paid vacation days per year, although there is quite a bit of variability and half of the workforce receives 15 days or less
FINDINGS: The average number of vacation days taken in the last year is 13.5; half of the workforce took 14 days or lessand 39% did not take all of the vacation days to which they were entitled • What was your longest vacation (including weekend days and paid holidays)? • 7 days was the most frequent length of longest vacation
FINDING: Having paid vacation time bodes well for personal health and well-being as well as intent to stay in one’s job Relationships between paid vacation time and positive outcomes Source: Families and Work Institute. 2008 NSCW (N=2,358 to 2,753); statistically significant differences are denoted as * (p<.05), ** (p<.01), *** (p<.001), n.s. (not statistically significant).
FINDING: Longer vacations offer greater benefits than shorter ones Relationships between length of longest vacation and positive outcomes Source: Families and Work Institute. 2008 NSCW (N=1,510 to 1,750); statistically significant differences are denoted as * (p<.05), ** (p<.01), *** (p<.001), n.s. (not statistically significant).
PART FOUR: Does Having an Effective Workplace Make a Difference?
FINDINGS: Demographic Changes in the Workforce Call for Changes in the Workplace • Women are now in the workforce in almost equal numbers as men, a trend bolstered by the current recession, which has cost more men their jobs than women • Four out of five couples are dual-earner couples today. The percentage of dual-earner couples has increased substantially over the past three decades — from 66% in 1977 to 79% in 2008 • Women in dual-earner couples contribute about 44% of the family income on average, a significantly greater portion than in 1997 when women contributed an average of 39%
FINDING: Work-life conflict is rising • The percentage of employees experiencing some or a lot of work-life conflict has increased significantly from 34% in 1977 to 44% in 2008 • Work-life conflict has increased especially among men — by eleven percentage points from 34% in 1977 to 45% in 2008. In comparison, the percentage of women experiencing work-life conflict has increased by five points from 34% in 1977 to 39% in 2008
FINDING: Employees in effective workplace have better work outcomes Relationships among varying levels of overall workplace effectiveness and positive work outcomes Source: Families and Work Institute. 2008 NSCW (N=1,952 to 2,296); statistically significant differences are denoted as * (p<.05), ** (p<.01), *** (p<.001), n.s. (not statistically significant).
FINDING: Some aspects of an effective workplace are more important than others in affecting work outcomes Effective workplace dimensions significantly predicting work outcomes rank-ordered by relative importance Source: Families and Work Institute. 2008 NSCW (N=2,470 to 2,769).
FINDING: Employees in effective workplaces have better health and well-being outcomes Relationships among overall effectiveness and positive health outcomes Source: Families and Work Institute. 2008 NSCW (N=2,243 to 2,295); statistically significant differences are denoted as * (p<.05), ** (p<.01), *** (p<.001), n.s. (not statistically significant).
FINDING: Some aspects of an effective workplace are more important than others in affecting health and well-being outcomes Effective workplace dimensions significantly predicting health outcomes rank-ordered by relative importance Source: Families and Work Institute. 2008 NSCW (N=2,471 to 2,769).
PART FIVE: What Are the Implications of These Findings?
Implications for Employers • Continue to promote health and wellness… • AND expand the definition of wellness to include making your workplace more effective by: • Providing learning opportunities • Giving employees some say about how to do their jobs • Providing forums for employees to contribute their ideas for improving the workplace • Helping employees to take action to improve their work-life fit and have the flexibility they need • Encouraging a culture of respect • Monitoring overwork and encouraging vacations
The State of Healthin the American Workforce Does Having an Effective Workplace Matter? Report Written by Kerstin Aumann and Ellen Galinsky Data Collection Funded by the Alfred P. Sloan Foundation