Download
1 / 28
280 likes | 538 Views
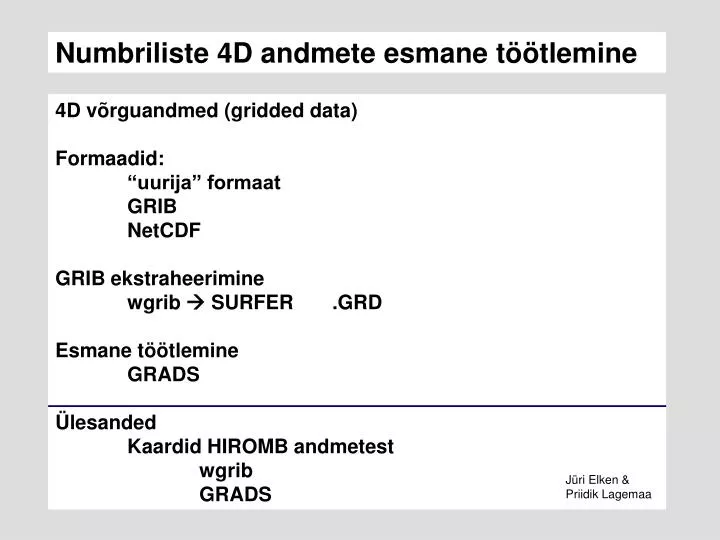
Numbriliste 4D andmete esmane töötlemine. 4D võrguandmed (gridded data) Formaadid: “uurija” formaat GRIB NetCDF GRIB ekstraheerimine wgrib SURFER .GRD Esmane töötlemine GRADS Ülesanded Kaardid HIROMB andmetest wgrib GRADS. Jüri Elken & Priidik Lagemaa.

E N D
Numbriliste 4D andmete esmane töötlemine 4D võrguandmed (gridded data) Formaadid: “uurija” formaat GRIB NetCDF GRIB ekstraheerimine wgrib SURFER .GRD Esmane töötlemine GRADS Ülesanded Kaardid HIROMB andmetest wgrib GRADS Jüri Elken & Priidik Lagemaa
Okeanograafiliste andmete iseloom üldjuhul juhuslikud väljad ψ(x,y,z,t) erijuhud: 1D aegrida ψ(x0 ,y0 ,z0 ,t) 1D sügavusprofiil ψ(x0 ,y0 ,z,t0 ) 1D horisontaalprofiil ψ(x,y0 ,z0 ,t0 ) ψ(x0 ,y,z0 ,t0 ) 2D horisontaalne kaart ψ(x,y,z0 ,t0 ) 2D aeg-sügavuslõige ψ(x0 ,y0 ,z,t) 2D ruumiline lõige ψ(x,y0 ,z,t0 ) ψ(x0 ,y,z,t0 ) Esitus: funktsiooni graafik Esitus: kaart
Võrguandmed (gridded data) x, y, z, t diskreetsete sammudega Erivariandid x, y: tasapinnaline x,y (sh pööratud) Lat, Lon (sh pööratud) ortogonaalne kõverjooneline (Lat, Lon on selle erijuht) Erivariandid z: sügavused/kihid (sageli muutuva kihi paksusega) sigma-koordinaat (jälgib sügavusi võrdsete vahedega) isopükniline (jälgib liikuvaid samatiheduspindasid) hübriidne (eelnevate kombinatsioon) vt ka http://www.msi.ttu.ee/~elken/SOL_07.ppt http://www.msi.ttu.ee/~elken/OceanLim_Notes15.pdf
“uurija” formaat Programmide näited: Uurija kirjutab ise näiteks FORTRANis talle sobivas formaadis ja loeb hiljem samal kujul sisse Kirjutamisel ja lugemisel tuleb üldjuhul kasutada täpselt samasugust andmete kirjeldust Tavaliselt puudub info andmete sisu ja aja kohta (selle saab panna küll faili nimesse) ning füüsilise/geograafilise ruumi kohta Jälgi kas fail on BIG või LITTLE ENDIAN!!! (windows on little-endian) DIMENSION T(200,200,10) !…..arvutused OPEN(20,’andmed.dat’, FORM=‘BINARY’) WRITE(20) T CLOSE(20) END DIMENSION T(200,200,10) OPEN(20,’andmed.dat’, FORM=‘BINARY’) READ(20) T CLOSE(20) !…..arvutused END
GRIB (GRIdded Binary) GRIB (GRIdded Binary) is a mathematically concise data format commonly used in meteorology to store historical and forecasted weather data. It is standardized by the World Meteorological Organization’s Commission for Basic Systems, known under number GRIB FM 92-IX, described in WMO Manual on Codes No.306. Currently there are two versions of GRIB, first edition (current sub-version is 2) is used operationaly world-wide by all meteorological centers, for Numerical Weather Prediction output (NWP). A newer generation was introduced, known as GRIB second edition, but it is used only by few centers and in many cases not for operational broadcast. Some of the second-generation GRIB are used for derived product distributed in Eumetcast of Meteosat Second Generation. GRIB superseded the Aeronautical Data Format (ADF). wikipedia
2 kirjega GRIB fail PDS GDS BMS BDS PDS GDS BMS BDS ‘GRIB’ ‘7777’ ‘7777’ ‘GRIB’ 1. kirje 2. kirje GRIB Formaat GRIB Fail koosneb erinevatest kirjetest, mis kõik on isekirjelduvad. Iga kirje (nt temperatuuri, veetaseme jne väli) koosneb sektsioonidest. GRIB 1 Section 0: Indicator Section.GRIB kirje alguse tähis ja pikkus Section 1: Product Definition Section (PDS).Standardsed definitsioonid kodeerituna (võrk, parameeter, aeg, väljaandja jne) Section 2: Grid Description Section (GDS) - Optional.Mittestandardsed definitsioonid. Kasutatakse juhul kui andmed ei ole PDS tabelitega kirjeldatavad Section 3: Bit Map Section (BMS) - Optional.Kasutatakse nt maa punktide märkimiseks so märgitakse ära millistes võrgusõlmedes on olemas andmedSection 4: Binary Data Section (BDS).Andmete pikkus ja andmedSection 5: '7777' - ASCII Characters indicating end of GRID record. Märgib kirje lõppu
GRIB formaadi iseärasusi • + • Isekirjeldav, äärmiselt kokku pakitud kiire andmeülekande jaoks. • Väga paindlik. • Operatiivses okeanograafias ja meteoroloogias üldlevinud standard. • - • Horisontaalne resolutsioon 0.001 kraadi, mis rannikumere jaoks on ebapiisav • 4D esituse asemel domineerib 2D, kus ühel ajahetkel on 3D väljad kirjutatud 2D väljade vahelduvaks jadaks. • Orienteeritud meteoandmetele. Mereprognooside puhul tehakse muudatused (üledefineerimised), mis lihtsate programmide juures ei toimi. Ka keerukama softi puhul esinevad konverteerimisel sageli tõrked. • Saadaval WINDOWS tarkvara (nt OCENS GRIB Explorer) mereprognooside faile ei ava. • Kaasaegsete tehnoloogiate (nt openDAP) tugi on nõrk
GRIB Software • Only decoders/encoders • WGRIB and WGRIB2 • Convsh • CDO • Picogrib • NCEP codes • JGrib • Meteosatlib • PyNIO • degrib • GRIB API • GRIB Java Decoder • GDAL • PyGrib • Viewers • GrADS • Xconv • NCAR Command Language (linux) • Ugrib • SmartMet • OpenCPN
Okeanograafias kasutatav GRIB tarkvara • WGRIB – Command line based program to manipulate, inventory and decode GRIB files • GrADS – Linux/Unix based desktop application that handles GRIB • Xconv/Convsh – Xconv is a graphical tool for displaying and converting gridded data, and is available for most operating systems. Convsh is the command-line equivalent. • CDO (Climate Data Operators) is an analysis tool for geoscientific data with GRIB support wikipedia
NetCDF (Network Common Data Form) NetCDF (Network Common Data Form)is a set of software libraries and self-describing, machine-independent data formats that support the creation, access, and sharing of array-oriented scientific data. The project homepage is hosted by the Unidata program at the University Corporation for Atmospheric Research (UCAR). The format is an open standard. NetCDF Classic and 64-bit Offset Format are an international standard of the Open Geospatial Consortium. The project is actively supported by UCAR. The recently released (2008) version 4.0 greatly enhances the data model by allowing the use of the HDF5 data file format. Version 4.1 (2010) adds support for C and Fortran client access to specified subsets of remote data via OPeNDAP. The format was originally based on the conceptual model of the NASA CDF but has since diverged and is not compatible with it. wikipedia The freely available distribution contains the C/C++/F77/F90 libraries, (plus tools ncgen/ncdump) and can be obtained as source code as a gzipped tar file or compressed tar file, or see our list of precompiled binaries on the netCDF 3.6.2 downloads page. http://www.unidata.ucar.edu/software/netcdf/
NetCDF formaadi iseärasusi • + • orienteeritud 4D andmetele • võimalikud suured failid üle 2 GB • palju “lehitsejaid” • OpenDAP tugi • suhteliselt lihtne siduda programmeerimiskeeltega (FORTRAN, C, MATLAB, PYTHON jne) • HDF5 tugi • - • Üldlevinud (NetCDF-3) andmete maht (väga) palju suurem kui GRIBil • NetCDF-4/HDF5 andmete maht mõistlik kuid veel ebastabiilne
NetCDF faili päis netcdf dataset-hbmV2PHYS-bal-latestforecast_1352145534043 { dimensions: time = 3 ; lat = 70 ; lon = 107 ; depth = 21 ; variables: int time(time) ; time:standard_name = "time" ; time:long_name = "time" ; time:units = "hours since 2012-11-05 12:00:00 UTC" ; time:axis = "t" ; time:_CoordinateAxisType = "Time" ; time:valid_min = 25 ; time:valid_max = 27 ; float lon(lon) ; lon:standard_name = "longitude" ; lon:long_name = "longitude" ; lon:units = "degrees_east" ; lon:unit_long = "Degrees East" ; lon:axis = "x" ; lon:_CoordinateAxisType = "Lon" ; lon:valid_min = 21.4583f ; lon:valid_max = 30.2917f ; float temp(time, depth, lat, lon) ; temp:_CoordinateAxes = "time depth lat lon" ; temp:standard_name = "sea_water_temperature" ; temp:long_name = "potential temperature" ; temp:units = "degree_Celsius" ; temp:unit_long = "degree Celsius" ; temp:valid_range = -3.00000f, 40.0000f ; temp:_FillValue = -999.000f ; temp:missing_value = -999.000f ; // global attributes: :title = "MyOcean Baltic MFC: Physical forecast" :institution = "Baltic MFC“ :references = "http://ocean.dmi.dk" :source = "HBM_V2 model output converted to NetCDF" :Conventions = "CF-1.0" :time_min = 25.0000 ; :time_max = 27.0000 ; :julian_day_unit = "hours since 2012-11-05 12:00:00 UTC" :z_min = 0.000000 ; :z_max = 100.000 ; :latitude_min = 56.5250 ; :latitude_max = 59.9750 ; :longitude_min = 21.4583 ; :longitude_max = 30.2917 ; }
ODV – Ocean Data View (Reiner Schlizer) http://odv.awi.de
http://www.cpc.ncep.noaa.gov/products/wesley/wgrib.html wgrib Otsi ja lae internetist alla wgrib.exe cygwin1.dll Tee Run cmd ja siis DOS aknas wgrib Kiiremaks navigeerimiseks käsureal kasuta Tab klahvi!!!
Laadiwgrib kataloogi loengumaterjalide hulgast BS01_200709040000+000H00M. Tippimise vähendamiseks kopeeri näiteks failiks BS01. Vaatame faili sisu: Ülesanne 1 (1) Kirje number Kirje alguse asukoht failis Kuupäev Parameetri lühend Kõrgus/sügavus KIRJE SISU TABELIST!!! Kust kõrgus mõõdetud Kõrgus/sügavus
Ülesanne 1 (2) Ekstraheerime kirje 16 (temperatuur veepinnal, vt eelmine slaid) tekstifaili Teisenda 1D tekstifail temp.dat SURFER 2D failiks temp.grd Laadi wgrib kataloogi loengumaterjalide hulgast txt2grd.exeja DOS aknas tee txt2grd temp.dat punkte x ja y suunas tühik (andmete puudumine) txt2grd.for ! Converts Text output from wgrib to 2D SURFER binary GRD file ! To add geographical reference, save in SURFER as ASCII file and edit bounds ! by Jüri Elken ! Usage: txt2grd input.xxx ! Output file is input.grd Ekstraheeri mõni teine kirje/väli ja joonista kaart Eesti rannikumeres
Geograafiliste koordinaatide määramiseks tee: wgrib bs01 -V GRD ASCII formaadis asenda: DSAA 752 735 0 751 0 734 6.0172600746155 18.613899230957
Xconv “kiireks” sirvimiseks ja konverteerimiseks http://badc.nerc.ac.uk/help/software/xconv/ • Xconv is an program designed to convert model output into a format suitable for use in various plotting packages. Xconv is designed to be simple to use with a point and click, X-windows based interface. Xconv can read data in the following formats: • Data output from the UKMO Unified Model • UKMO PP format • GRIB format • Netcdf format • Drs format • The following output formats are supported by xconv: • Netcdf format • Drs format • Utf format
Grid Analysis and Display System (GrADS) Center for Ocean-Land-Atmosphere Studies http://grads.iges.org/grads/ The Grid Analysis and Display System (GrADS) is an interactive desktop tool that is used for easy access, manipulation, and visualization of earth science data. The format of the data may be either binary, GRIB, NetCDF, or HDF-SDS (Scientific Data Sets). GrADS has been implemented worldwide on a variety of commonly used operating systems and is freely distributed over the Internet. GrADS uses a 4-Dimensional data environment: longitude, latitude, vertical level, and time. Data sets are placed within the 4-D space by use of a data descriptor file. GrADS interprets station data as well as gridded data, and the grids may be regular, non-linearly spaced, gaussian, or of variable resolution. Data from different data sets may be graphically overlaid, with correct spatial and time registration. Operations are executed interactively by entering FORTRAN-like expressions at the command line. A rich set of built-in functions are provided, but users may also add their own functions as external routines written in any programming language.
Data may be displayed using a variety of graphical techniques: line and bar graphs, scatter plots, smoothed contours, shaded contours, streamlines, wind vectors, grid boxes, shaded grid boxes, and station model plots. Graphics may be output in PostScript or image formats. GrADS provides geophysically intuitive defaults, but the user has the option to control all aspects of graphics output. GrADS has a programmable interface (scripting language) that allows for sophisticated analysis and display applications. Use scripts to display buttons and dropmenus as well as graphics, and then take action based on user point-and-clicks. GrADS can be run in batch mode, and the scripting language facilitates using GrADS to do long overnight batch jobs.
GrADS kasutamine HIROMB GRIB failide jaoks Installeerimiseks valida: Win32e GrADS is a port of Brian Doty 's popular Grid Analysis and Display System (GrADS) to the x86 PC running 32-bit MS Windows operating sytems (win9x, winNT, win2000), without the need for installing an X server • Installeerimine (Win32e GrADS 1.8sl11) • Käivita “grads-1.8sl11-win32e.exe” (http://ftp.kumamoto-u.ac.jp/pub/.2/graphic/grads/1.8/) • Tekita environment variabled (system propertiesadvanced environment variables) • GADDIR=C:\Program Files\PCGrADS\dat • DISPLAY=800x600x16M Windows keskkonnas tuleb andmed üldjuhul kopeerida Win32e kataloogi või kasutada täispikki failinimesid. GRIB failide lugemiseks peab seal olema (loengumaterjali hulgast): GRIB andmefail (HIROMB) BS01_200709040000+000H00M HIROMB indeksfail bs01.idx Andmete defineerimisfail bs01.ctl Projektsioonide jaoks skript bsmap.gs
GrADS töötab käsuridadega: projektsioonideks: run bsmap.gs andmed sisse: open bs01.ctl defineeritakse koordinaadid (üks väärtus või vahemik) kui kaks vahemikku on tulemuseks kaart, kui üks siis graafik sügavuste vahemik suuremast väärtusest väiksemani muutuja nimi võetakse bs01.ctl failist Temperatuur pinnal: set lev 4 d tmp Soolsus: d salty Põhikäsud: open failinimi.ctl- avab faili set lev maxsügavus minsügavus- muudab sügavust set lat minlat maxlat- muudab latituuti set lon minlon maxlon d muutujanimi- kuvab muutuja c- puhastab ekraani set gxout graafikutüüp- vahetab graafiku tüüpi printim väljundfaili_nimi.png white x1600 y1200- salvestab ekraanil oleva pildi png faili valge taustaga http://www.iges.org/grads/gadoc/gadocindex.html
GrADS skriptid • Kõik käsud on võimalik kirjutada skriptifaili nt minuskript.gs • Skripti kasutamise plussid ja miinused: • Kui midagi valesti läheb ei pea jälle otsast alustama • Skript jääb alles ja seda on järgmine kord hea kasutada kui vaja läheb • Kui vaja teha mitu sarnast pilti saab palju kiiremini valmis • Alustades natukene ebamugavam töötada • 'set gxout shaded' • 'd dslm' • 'set gxout vector' • 'set arrscl 1 40' • 'set arrowhead 0.015' • 'set ccolor 1' • 'd skip(ugrd,5,10);skip(vgrd,5,10)' * Sample script by Priidik Lagemaa to plot some sample plots for lecture * First clear the display 'c' * open control file 'open ../dat/bs01.ctl' * set projections 'run bsmap.gs' * set x,y,z limits and/or levels 'set lev 4' 'set lon 21 30' 'set lat 56.5 61' * set output graph type 'set gxout shaded' * display variable 'd tmp' * draw contours 'set gxout contour' 'd tmp' * draw legend and title 'run cbarn' 'draw title Temperatuur' * save as png image with white background 'printim ../dat/tmp.png white x1600 y1200'
Ülesanne 2 • Teha gradsi skriptid, mis joonistavad kaardid, lõiked ja graafikud Eesti rannikumeres. Kaardi projektsioonid paika panna ja varustada kontuurjoontega. Kõik joonised varustada legendiga ja pealkirjaga. Salvestada png formaadis valge taustaga. • temperatuur TMP • soolsus SALTY • veetase DSLM • Kaardi piirid, lõike ja graafiku punkt valida ise. • Tulemused ja skriptid saata priidik26@gmail.com
Ülesanne 3 (valida kas ülesanne 2 või 3) Teha gradsi skript, mis joonistab põhjakihi soolsuse Eesti rannikumeres. Kaardi projektsioonid paika panna, varustada legendiga ja pealkirjaga. Salvestada png formaadis valge taustaga. Kaardi piirid valida ise. Tulemused ja skriptid saata priidik26@gmail.com