Download
1 / 1
10 likes | 141 Views
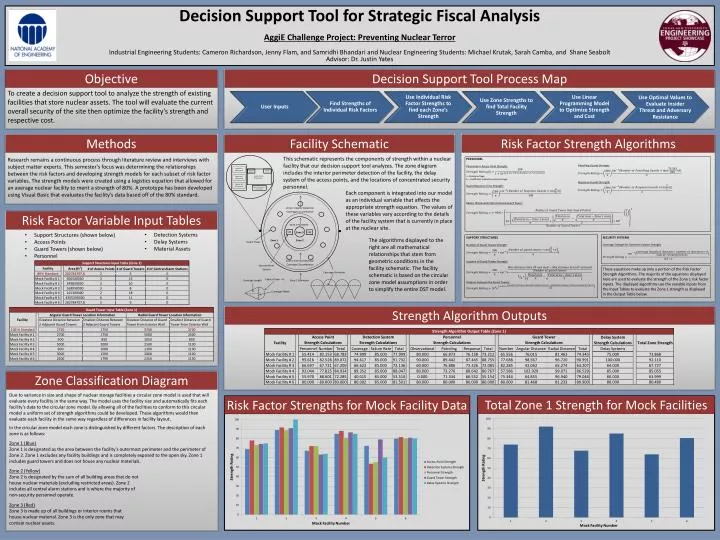
Decision Support Tool for Strategic Fiscal Analysis AggiE Challenge Project: Preventing Nuclear Terror Industrial Engineering Students: Cameron Richardson, Jenny Flam, and Samridhi Bhandari and Nuclear Engineering Students : Michael Krutak , Sarah Camba , and Shane Seabolt

E N D
Decision Support Tool for Strategic Fiscal Analysis • AggiE Challenge Project: Preventing Nuclear Terror • Industrial Engineering Students: Cameron Richardson, Jenny Flam, and SamridhiBhandari and Nuclear Engineering Students: Michael Krutak, Sarah Camba, and Shane Seabolt • Advisor: Dr. Justin Yates Objective Decision Support Tool Process Map To create a decision support tool to analyze the strength of existing facilities that store nuclear assets. The tool will evaluate the current overall security of the site then optimize the facility’s strength and respective cost. This schematic represents the components of strength within a nuclear facility that our decision support tool analyzes. The zone diagram includes the interior perimeter detection of the facility, the delay system of the access points, and the locations of concentrated security personnel. Methods Risk Factor Strength Algorithms Facility Schematic Research remains a continuous process through literature review and interviews with subject matter experts. This semester’s focus was determining the relationships between the risk factors and developing strength models for each subset of risk factor variables. The strength models were created using a logistics equation that allowed for an average nuclear facility to merit a strength of 80%. A prototype has been developed using Visual Basic that evaluates the facility’s data based off of the 80% standard. Each component is integrated into our model as an individual variable that affects the appropriate strength equation. The values of these variables vary according to the details of the facility system that is currently in place at the nuclear site. Risk Factor Variable Input Tables • Detection Systems • Delay Systems • Material Assets • Support Structures (shown below) • Access Points • Guard Towers (shown below) • Personnel PERSONNEL Personnel in Access Point Strength: i = Personnel type ki= Coefficient related to personnel type Guard Response Time Strength: Radius that Guards Patrol Around Guard Tower: • Patrolling Guards Strength: • Response Guards Strength: SUPPORT STRUCTURES Number of Guard Towers Strength: Location of Guard Towers Strength: Distance between the Guard Towers: SECURITY SYSTEMS Coverage Strength for Detection System Strength: The algorithms displayed to the right are all mathematical relationships that stem from geometric conditions in the facility schematic. The facility schematic is based on the circular zone model assumptions in order to simplify the entire DST model. These equations make up only a portion of the Risk Factor Strength Algorithms. The majority of the equations displayed here are used to evaluate the strength of the Zone 1 risk factor inputs. The displayed algorithms use the variable inputs from the Input Tables to evaluate the Zone 1 strength as displayed in the Output Table below. Strength Algorithm Outputs Zone Classification Diagram Due to variance in size and shape of nuclear storage facilities a circular zone model is used that will evaluate every facility in the same way. The model uses the facility size and automatically fits each facility’s data to the circular zone model. By allowing all of the facilities to conform to this circular model a uniform set of strength algorithms could be developed. These algorithms would then evaluate each facility in the same way regardless of differences in facility layout. Total Zone 1 Strength for Mock Facilities Risk Factor Strengths for Mock Facility Data In the circular zone model each zone is distinguished by different factors. The description of each zone is as follows: Zone 1 (Blue) Zone 1 is designated as the area between the facility’s outermost perimeter and the perimeter of Zone 2. Zone 1 excludes any facility buildings and is completely exposed to the open sky. Zone 1 includes guard towers and does not house any nuclear materials. Zone 2 (Yellow) Zone 2 is designated by the sum of all building areas that do not house nuclear materials (excluding restricted areas). Zone 2 includes all central alarm stations and is where the majority of non-security personnel operate. Zone 3 (Red) Zone 3 is made up of all buildings or interior rooms that house nuclear material. Zone 3 is the only zone that may contain nuclear assets.