Download
1 / 21
210 likes | 317 Views
Automated Calibration Stamp Technology for Improved In-Season Nitrogen Fertilization. K. Freeman, R. Teal, C. Mack, K. Martin, B. Arnall, K. Desta, J. Solie, M. Stone, H. Zhang, B. Raun. Review.

E N D
Automated Calibration Stamp Technology for Improved In-Season Nitrogen Fertilization K. Freeman, R. Teal, C. Mack, K. Martin, B. Arnall, K. Desta, J. Solie, M. Stone, H. Zhang, B. Raun
Review • Pre-sidedress nitrate test (PSNT) was an extension of preplant nitrate tests, in-season soil nitrate analysis was used to refine topdress rates (Bundy and Andraski, 1995). • Predicting N mineralized from soil organic matter could lead to improved N fertilizer recommendations (Cabrera and Kissel, 1988). • Mulvaney et al. (2001) found that the concentration of amino sugar N was highly correlated with check-plot yields and fertilizer N response. • Temporal variability strongly influences N supplied by soil organic matter and the demand for in-season N
Review (cont) • In many states, 33 kg N ha-1 is recommended for every 1 Mg of anticipated wheat yield (2 lb N ac-1 for every bushel of expected wheat grain yield) • This strategy explicitly places the risk of predicting the environment (good or bad year) on the farmer • Varvel et al. (1997) employed chlorophyll meter readings to calculate a sufficiency index: in-season N fertilizer applications were made when index values were below 95%. • Sufficiency index < 90% at the V8 growth stage in corn, maximum yields could not be achieved with in-season N fertilizer applications (Varvel, 1997).
Review • Normalized difference vegetation index (NDVI) divided by the number of days from planting to sensing used to predict mid-season winter wheat yield potential (OSU) • Response Index: N Rich Strip (sufficient nitrogen but not excess) strip and the adjacent area with the field rate of preplant applied N. • Although systems have been developed to determine midseason N fertilizer topdress recommendations, the need exists for a simple system that cereal grain producers can use to quickly estimate required N topdress rates.
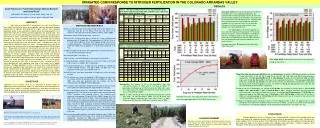
Response Indexvariable from year to year in the same field 2004 RI = 1.7 1995 RI = 1.2 Long term N-P-K Experiments(1969-2004) Dr. Billy Tucker
Response to Fertilizer NLong-Term Wheat ExperimentLahoma, OK 1970-2003
14 12 10 0-N kg/ha UAN-180 kg N/ha 8 Grain Yield, Mg/ha 6 4 2 0 1969 1970 1971 1972 1973 1974 1975 1976 1977 1978 1979 1980 1981 1982 1983 4 3.5 3 Response Index 2.5 2 1.5 1 1969 1970 1971 1972 1973 1974 1975 1976 1977 1978 1979 1980 1981 1982 1983 Response to Fertilizer N Response to Fertilizer N Long-Term Corn Experiment Mead, NE, 1969 - 1983 Mead, NE, 1969 - 1983 Prof. R.A. Olson Prof. R.A. Olson
Materials and Methods • 2003 Honda FourTrax Foreman ES 4-wheeler (433-cc, 127-cm wheel base, 116-cm wide) with a 3-m wide spray boom and a 1-m spacing between nozzles • Modified to deliver a range of fixed N rates as urea ammonium nitrate (28 %N) within a 9-m2 grid. • 9 separate 1-m2 areas • Four corners receive no fertilizer N. • Rates of 22, 45, 67, 90, and 112 kg N ha-1 occupy the other 5
lb N / acre 80 0 0 20 100 60 0 40 0 Blue Dye, 30 ml L-1
Pumpless pressurized spray system19L auxiliary air tank11.3L Spartanburg stainless steel tankProgrammable logic controllerRemcor solenoid valves Automated Calibration Stamp
Winter WheatCalibration Stamp applied in DecemberVisual Interpretation in March
Topdress N rate prescribed by choosing the lowest N rate where no visual differences were observed between it and the highest rate.
December CalibrationStamp March
Results • Field-specific topdress N rate prescribed by choosing the lowest N rate where no visual differences were observed between it and the highest rate. • N Rate NDVI N Rate NDVI N Rate NDVI • 100 0.80 100 0.76 100 0.69 • 80 0.79 80 0.74800.68 • 60 0.78 60 0.68 60 0.69 • 40 0.65 40 0.55 40 0.67 • 20 0.55 20 0.45 20 0.68 • 0 0.51 0 0.41 0 0.54
http://www.soiltesting.okstate.edu/SBNRC/SBNRC.php www.nue.okstate.edu
N Rich Strip (J. Lawles, S. Reed)NTech Industrieswww.ntechindustries.com
Summary • Calibration stamps applied preplant or soon after planting assist in providing visual interpretation of N mineralization + atmospheric N deposition from planting to the time mid-season N is applied, and improved determination of topdress N rates. • Cost: Honda 4X = $5000Tanks, Controller, Nozzles, Valves, Boom, Programming, Labor = $800 • Can be used with on-line Sensor Based N Rate Calculator to improve mid-season N management
GreenSeeker-Red Average NDVI = 0.816, standard deviation in NDVI = 0.0056 Distance to target: 0.8-1.2m
>15 readings 0.4m2 +/- 0.005