Download
1 / 41
510 likes | 1.44k Views
Genetic Mapping. Establishing relative positions of genes along chromosomes using recombination frequencies Enables location of important disease genes Allows isolation and analysis of new genes Essential framework for human genome project. y w m f B

E N D
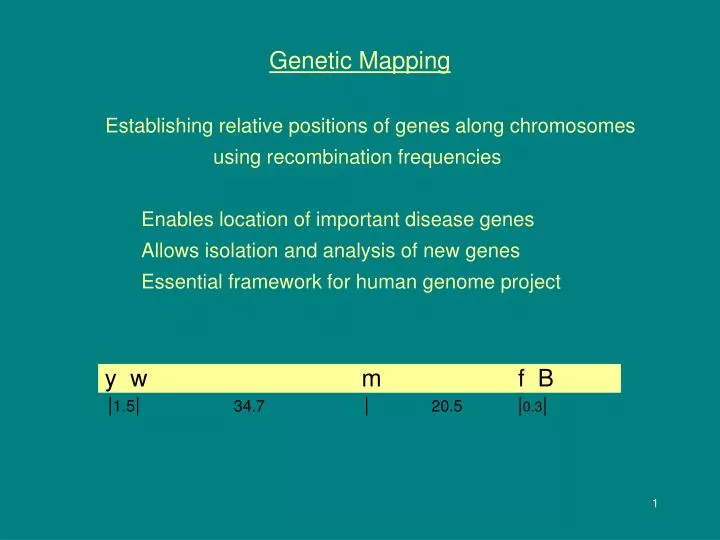
Genetic Mapping Establishing relative positions of genes along chromosomes using recombination frequencies Enables location of important disease genes Allows isolation and analysis of new genes Essential framework for human genome project y w m f B |1.5| 34.7 | 20.5 |0.3| 1
Unlinked Genes - Independent Assortment 50% 50% 3
Adjacent Genes - Complete Linkage 100% 0% 4
Incomplete Linkage - Recombination Possible > 50% < 50% 5
Recombinants result from CO in heterozygote Maximum recombinants 50% 6
Recombinants result from CO in heterozygote 50% recombinant 50% recombinant 100% recombinant 7
Crossing over occurs during Meiosis I Pachynema Drosophila - Recombination occurs in females Complete linkage (no CO) in males Humans - Different rates of recombination Males vs Females Chromosome regions Hot spots, Cold spots 8
Genetic Mapping Principles Recombination-based maps assume: recombination rates distance between genes 9
Genetic Map Units Defined # CO # recombinants # CO distance between genes Therefore, # recombinants distance 10
Genetic Map Units Defined Sturtevant (1913) Distance yielding 1% recombinant testcross progeny = 1 map unit (mu, centiMorgan, cM) 10 mu = 10% 11
Calculating Map Units - Two Point Testcross Linked mutant genes are coupled (cis-configuration) 12
Calculating Map Units - Two Point Testcross Two genes linked P > 50% R < 50% Distance between b+ b and vg + vg = 18 mu 13
Calculating Map Units - Two Point Testcross Linked mutant genes are in repulsion (trans-configuration) 14
Calculating Map Units - Two Point Testcross Linked genes are in repulsion (trans-configuration) P > 50% R < 50% Distance between b+ b and vg + vg = 18 mu 15
Two Point Testcross - Sample Problem 1 Parental? Recombinant? Are genes linked? If so, how many map units between them? How are alleles arranged on F1 female’s chromosomes? 17
Two Point Testcross - Sample Problem 2 Parental? Recombinant? Are genes linked? If so, how many map units between them? How are alleles arranged on F1 female’s chromosomes? 18
Two Point Testcross - Sample Problem 3 Parental? Recombinant? Are genes linked? If so, how many map units between them? How are alleles arranged on F1 female’s chromosomes? 19
Testcross versus F1 x F1 cross 1/2 masked by male b+ vg + chromosome 20
Predicting Results - Two Point Testcross If you screened 1000 testcross progeny, how many would you expect to have normal body color and miniature wings? 21
Compare Expectations to Observations - Chi Square Degrees of freedom = # categories -1; 4 phenotypes; 3 DF From Chi Square table, find corresponding probability p < 0.05, differ significantly p >0.05, observations fit expectations 22
Mapping Three Genes - Three Point Testcross P vs DCO indicates middle gene 24
Three Point Testcross - Determining Middle Gene Figure 15.7 25
Three Point Testcross - Strategies F1 Aa Bb Cc X aa bb cc Arrange as reciprocals A- B- C- (low) aa bb cc (low) A- B- cc (high) aa bb C- (high) A- bb cc (int.) aa B- C- (int.) aa B- cc (int.) A- bb C- (int.) Parental? DCO? SCO? What is the middle gene? Arrangement in F1 heterozygote? 26
Three Point Testcross - Strategies Map distances - Adjacent genes = (SCO + DCO) x 100 total Outside genes = (SCOI+SCOII+2DCO) x 100 total b - bw = ((200 + 20)/1000) x 100 = bw - vg = ((180 + 20)/1000) x 100 = b - vg = (((200 + 180 + 2(20))/1000) x 100 = 27
Three Point Testcross - Sample from Text Distance between p+ p and j+ j? j+ j and r+ r? p+ p and r+ r? 28
Three Point Testcross - Sample Arrangement of genes in heterozygous parent? b B Map units? Aa - Bb Bb - Cc Aa - Cc Parental? DCO? SCO I? SCO II? Middle gene? 29
Dealing with Unusual Testcross Results No clear P or DCO Look at two genes at a time Aa-Bb: P R Aa-Cc: P R Bb-Cc: P R 31
Genetic Mapping - Strategies Genes separated by 50 or more map units appear unlinked. In most cases, map units are additive. Use shorter distance to establish complete linkage map. 32
Genetic Mapping - Strategies Studying only two genes can underestimate map distances. Only odd # of CO counted among recombinants; even # not noticed Fewer recombinants observed, shorter apparent map distance Most accurate map unit calculation for distant genes: Add shorter distances between genes 33
Interference CO in one region affects CO in adjacent region coefficient of coincidence = cc = Observed DCO/Expected DCO Interference = i = 1 - cc Fewer CO than expected: cc = 280/400 i = 1-0.7 = + 0.3 More CO than expected: cc = 500/400 i = 1-1.25 = - 0.25 34
Interference Most organisms, mu > 30, i = 0 Drosophila - 10 mu or less, i = 1, no DCOs occur 35
Genetic Mapping Functions Mapping Functions - for genetic distances > ~ 7 mu, correct for the fact that when multiple crossovers occur, unnoticed even numbers lead to underestimate of map units Haldane’s (assumes no interference, d = CO frequency, e = base natural logarithms) At 20% recombination, true map distance approaches 30 36
Genetic Mapping in Humans • Pedigree Analysis X-linkage, Linkage to Markers (LOD scores) Karyotype Analysis: Chromosome changes (deletion, rearrangement) 37
Genetic Mapping in Humans • Molecular Approaches DNA profiling, PCR and RE markers, in situ hybridization Sequencing (physical mapping) 38
Genetic Mapping in Humans Cell Hybridization - Interspecific hybrids 39
Genetic Mapping in Humans • Cell Hybridization - Synteny testing 40
Genetic Mapping in Humans 4) LOD score analysis Calculate likelihood of pedigree based on alternative assumption that loci are: linked ( = possible map distance = x) or unlinked ( = 0.5) Ratio of two likelihoods gives odds of linkage Lod score = log of likelihood ratio LOD = x = Z x = Log10Odds of observed result if = x Odds of observed result if = 0.5 41