Download
1 / 14
140 likes | 327 Views
Cerebral Haemodynamics and Auto-Regulatory Models of the Circle of Willis. K T Moorhead, C V Doran, J G Chase, and T David University of Canterbury Dept of Mechanical Engineering. Research Goals.

E N D
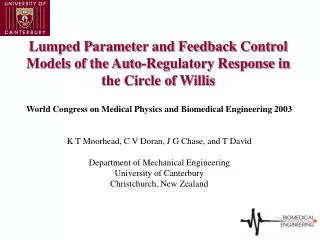
Cerebral Haemodynamics and Auto-Regulatory Models of the Circle of Willis K T Moorhead, C V Doran, J G Chase, and T David University of Canterbury Dept of Mechanical Engineering
Research Goals • Desire: Better understand cerebral haemodynamics in the Circle of Willis cerebral arterial system (CoW) • Including realistic dynamics for auto-regulation phenomenon • Account for “essential dynamics” of the system • Match existing clinical data and/or understanding • Goal: Create a simplified model of CoW haemodynamics to assist in rapid diagnosis of stroke risk patients prior to surgery or other procedures • Must be computationally simpler than higher dimensional CFD • Must be flexible enough to model different geometry’s and conditions of the CoW arterial system
Circle of Willis (CoW) Definitions Simplified geometry schematic of arterial system for basic dynamic analysis
R P2 P1 q Modeling the CoW Constant resistance between nodes captured by simple circuit analogy: Q = (P1 – P2)/R Leads to system of linear equations for flow rates q(t) due to input conditions p(t): Ax(t) = b(t) Auto-regulation not included yet
Auto-Regulation • Dynamic phenomena where in blood perfusion pressure to efferent arteries (L and R: ACA, MCA, PCA) is maintained within set limits. • Feedback controlled system based on the body’s sensing of changes of flow rate from a set (desired) reference. • Control input “u” changes the dilation/contraction of the arterioles within the cerebral territory supplied by the efferent artery to increase (flow to high) or decrease (flow to low) resistance. Auto-regulation modeled as feedback controlled, time varying resistances on efferent arteries, creating a non-linear system
q ¹ qref vessel wall Ca smooth muscle cells Auto-Regulation Model • Pressure and/or flow that is different than desired is sensed • Ca ions released • Triggering muscle fiber contraction/expansion • Contracting/Dilating vessel radius • Changing resistance of vessels Resistance dynamics of contraction/dilation Standard PID feedback control law Amount of change is limited Resistance is a function of error,e(t) Error is a function of flow rates Flow rates are what you solve for System is nonlinear: A(x(t))*x(t) = b(t) Solve it iteratively between resistance and flow rates
Model Parameters • Reference and constant resistances based known physiological data • Lengths, radii, etc • Communicating arteries generally have very high resistance • Geometry may commonly have one omitted element • Physiological data from thigh cuff experiments is used to determine control gains • Correlated to match 20% drop and 20 second return time in clinical data for 20 mmHg drop in afferent blood pressure • Reference resistances for efferent arteries determined to match physiological data which states that efferent resistances follow the ratio (6:3:4) for the ACA:MCA:PCA arteries in the steady state • Boundary conditions: • Afferent pressure: 93mm Hg • Efferent pressure: 4mm Hg
Simulations Run • Drop in RICA of 20mm Hg is tested to simulate a stenosis • Simulations run for a single vessel omission, testing each element of the CoW • Used to verify model versus prior research using higher dimensional (2D) CFD methods that are computationally intense • Simulation of a high risk stroke case with ICA blockage increasing resistance • To illustrate potential of this model. • All simulations run for symmetric configuration where resistances on L and R sides are not varied.
% drop in flow through RMCA after 20% pressure drop in RICA (Ferrandez, 2002) (Present Model) Balanced Configuration 18 19 Missing LPCA1 Not simulated 19 Missing LPCoA 18 19 Missing LACA1 18 20 Missing ACoA 18 20 Missing RACA1 20 21 Missing RPCoA 20 19 Missing RPCA1 Not simulated 19 Results – Omitted Artery Cases • No failure to return to qref flow • Return times ~15-25 seconds • Shows robustness of CoW system in maintaining flow and pressure
Results – Omitted Artery Cases Change in flow rate due to pressure drop: No omitted arteries Redshows change direction from steady state ACoA omitted – common anomaly All results are % change of steady state values Prior to pressure drop Note loss of communicating artery flow to support right side
Results – High Stroke Risk Case • High stroke risk case: • LICA and RICA radii reduced 50% and 30% respectively, representing potential carotid artery blockages • LPCA1 (Left Proximal Posterior Cerebral Artery) is omitted • 20mm Hg pressure drop in RICA simulating a stenosis is simulated • This individual would be hypertensive to maintain steady state flow requirements – captured by model. • 93mm Hg does not maintain reference flow rates in several efferent arteries, even at maximum dilation • ~113mm Hg required to attain desired level. Case is not common in all individuals but is encountered in those needing carotid artery surgery
Results – High Stroke Risk Case LEFT RIGHT LMCA fails to achieve desired flow rate indicating a potential stroke risk under any procedure which entails such a pressure drop
Conclusions • A new, simple model of cerebral haemodynamics created • Model includes dynamics of auto-regulation and is non-linear • Iterative solution method developed offering fast solution and enabling use as a rapid diagnosis “what-if” tool. • Model verified against limited clinical data and prior research using higher dimensional CFD • Several simulations run for omitted artery cases illustrate the robustness of the CoW • High stroke risk case illustrates the potential for simulating patient specific geometry and situation to determine risk • Future work includes more physiologically accurate auto-regulation and geometry modelling, more clinical verification using existing data, and modelling of greater variety of potential structures (eg fused vessels).
Punishment of the Innocent Questions ???