Download
1 / 17
170 likes | 259 Views
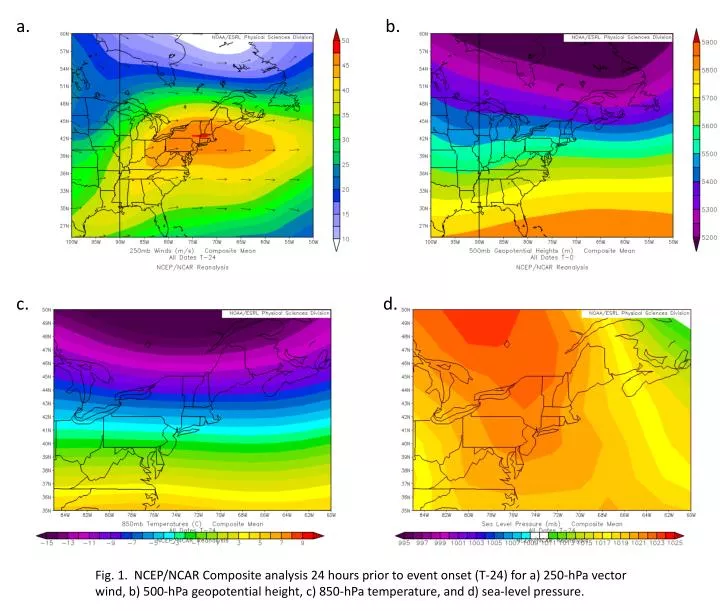
Fig. 1. NCEP/NCAR Composite analysis 24 hours prior to event onset (T-24) for a) 250-hPa vector wind, b) 500-hPa geopotential height, c) 850-hPa temperature, and d) sea-level pressure. a. b. c. d.

E N D
Fig. 1. NCEP/NCAR Composite analysis 24 hours prior to event onset (T-24) for a) 250-hPa vector wind, b) 500-hPa geopotential height, c) 850-hPa temperature, and d) sea-level pressure. a. b. c. d. Fig. 1. NCEP/NCAR Composite analysis 24 hours prior to event onset (T-24) for a) 250-hPa vector wind, b) 500-hPa geopotential height, c) 850-hPa temperature, and d) sea-level pressure.
a. b. c. d. Fig. 2. NCEP/NCAR Composite analysis 12 hours prior to event onset (T-12) for a) 250-hPa vector wind, b) 500-hPa geopotential height, c) 850-hPa temperature, and d) sea-level pressure.
a. b. c. d. Fig. 3. NCEP/NCAR Composite analysis at event onset (T-0) for a) 250-hPa vector wind, b) 500-hPa geopotential height, c) 850-hPa temperature, and d) sea-level pressure.
a. b. c. d. Fig. 4. NCEP/NCAR Composite analysis 12 hours after event onset (T+12) for a) 250-hPa vector wind, b) 500-hPa geopotential height, c) 850-hPa temperature, and d) sea-level pressure.
a. b. c. d. Fig. 5. NCEP/NCAR Composite analysis 24 hours after event onset (T+24) for a) 250-hPa vector wind, b) 500-hPa geopotential height, c) 850-hPa temperature, and d) sea-level pressure.
a. b. c. d. Fig. 6. NCEP/NCAR Composite analysis of criteria events for Plymouth, NH 24 hours prior to event onset (T-24) for a) 250-hPa vector wind, b) 500-hPa geopotential height, c) 850-hPa temperature, and d) sea-level pressure.
a. b. c. d. Fig. 7. NCEP/NCAR Composite analysis of non-criteria events for Plymouth, NH 24 hours prior to event onset (T-24) for a) 250-hPa vector wind, b) 500-hPa geopotential height, c) 850-hPa temperature, and d) sea-level pressure.
a. b. c. d. Fig. 8. NCEP/NCAR Composite analysis of criteria events for Plymouth, NH 12 hours prior to event onset (T-12) for a) 250-hPa vector wind, b) 500-hPa geopotential height, c) 850-hPa temperature, and d) sea-level pressure.
a. b. c. d. Fig. 9. NCEP/NCAR Composite analysis of non-criteria events for Plymouth, NH 12 hours prior to event onset (T-12) for a) 250-hPa vector wind, b) 500-hPa geopotential height, c) 850-hPa temperature, and d) sea-level pressure.
a. b. c. d. Fig. 10. NCEP/NCAR Composite analysis of criteria events for Plymouth, NH at event onset (T-0) for a) 250-hPa vector wind, b) 500-hPa geopotential height, c) 850-hPa temperature, and d) sea-level pressure.
a. b. c. d. Fig. 11. NCEP/NCAR Composite analysis of non-criteria events for Plymouth, NH at event onset (T-0) for a) 250-hPa vector wind, b) 500-hPa geopotential height, c) 850-hPa temperature, and d) sea-level pressure.
a. b. c. d. Fig. 12. NCEP/NCAR Composite analysis of criteria events for Plymouth, NH 12 hours after event onset (T+12) for a) 250-hPa vector wind, b) 500-hPa geopotential height, c) 850-hPa temperature, and d) sea-level pressure.
a. b. c. d. Fig. 13. NCEP/NCAR Composite analysis of non-criteria events for Plymouth, NH 12 hours after event onset (T+12) for a) 250-hPa vector wind, b) 500-hPa geopotential height, c) 850-hPa temperature, and d) sea-level pressure.
a. b. c. d. Fig. 14. NCEP/NCAR Composite analysis of events for Plymouth, NH 12 hours after event onset (T+12) for a) criteria surface temperature, b) non-criteria surface temperature, c) criteria surface vector wind, and d) non-criteria surface vector wind.
a. b. c. d. Fig. 15. NCEP/NCAR Composite analysis of criteria events for Plymouth, NH 24 hours after event onset (T+24) for a) 250-hPa vector wind, b) 500-hPa geopotential height, c) 850-hPa temperature, and d) sea-level pressure.
a. b. c. d. Fig. 16. NCEP/NCAR Composite analysis of non-criteria events for Plymouth, NH 24 hours after event onset (T+24) for a) 250-hPa vector wind, b) 500-hPa geopotential height, c) 850-hPa temperature, and d) sea-level pressure.
a. b. c. d. Fig. 17. NCEP/NCAR Composite analysis of events for Plymouth, NH 24 hours after event onset (T+24) for a) criteria surface temperature, b) non-criteria surface temperature, c) criteria surface vector wind, and d) non-criteria surface vector wind.