Download
1 / 24
240 likes | 428 Views
LAPS Ceiling and Visibility Tri-agency meeting. Steve Albers, Isidora Jankov, Dan Birkenheuer, Paul Schultz, Yuanfu Xie, Zoltan Toth, and Ed Szoke OAR/ESRL/GSD/FAB Nov 30 – Dec 2, 2010. Updated 2200UTC Dec 1, 2010. LAPS Niche.

E N D
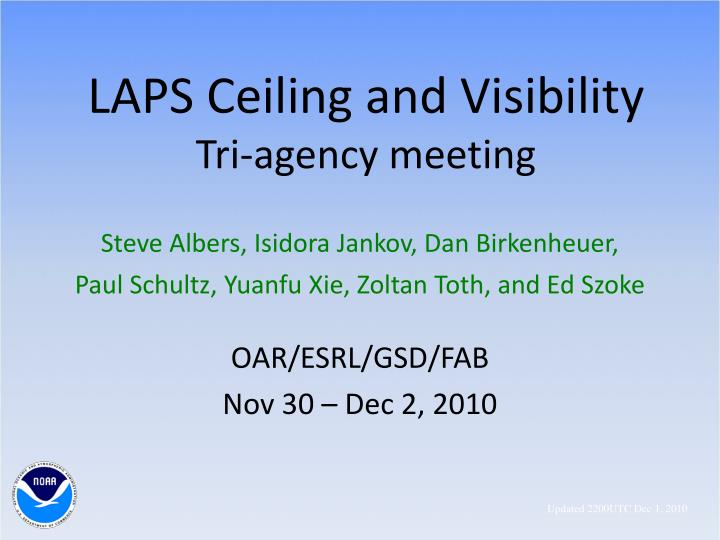
LAPS Ceiling and VisibilityTri-agency meeting Steve Albers, Isidora Jankov, Dan Birkenheuer, Paul Schultz, Yuanfu Xie, Zoltan Toth, and Ed Szoke OAR/ESRL/GSD/FAB Nov 30 – Dec 2, 2010 Updated 2200UTC Dec 1, 2010
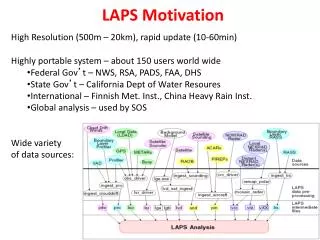
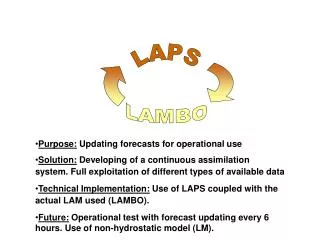
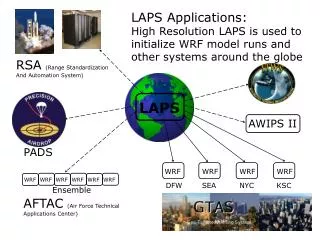
LAPS Niche • Highly Portable System, Easy to Use – Many Collaborators/users World Wide • Federal/State Gov’t, International, Academia, Private Sector • NWS/AWIPS, GTAS, FAA/COSPA, RSA, PADS, CWB Taiwan • Wide variety • of data sources: • High Resolution (500m – 20km), Rapid Update (10-60min), Local to Global: • 1km analysis, 15min frequency, 25-30 minute latency • Versus 60min frequency / ~60-90min latency for other hi-res analysis systems (e.g. RTMA) 2
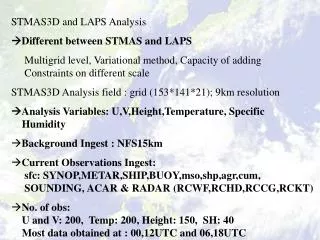
LAPS DA-Ensemble System Data Data Ingest Intermediate data files Error Covariance Trans LAPS GSI AIVs C&V / Icing Convection Winds Turbulence STMAS3D Trans Post proc1 Post proc2 Post proc3 Model prep WRF-ARW MM5 WRF-NMM Probabilistic Post Processing Ensemble Forecast OAR/ESRL/GSD/Forecast Applications Branch 3
LAPS TEAM • Data assimilation • Steve Albers, Yuanfu Xie • Satellite and other observations • Dan Birkenheuer, Seth Gutman, Kirk Holub, Tomoko Koyama • Physical processes • Paul Schultz • Ensemble forecasting • Isidora Jankov • Evaluation and verification • Ed Tollerud, Ed Szoke • Software engineering • Linda Wharton, Paula McCaslin • Technical support • Adrienne Rose, Joanne Krumel, Stanislav Stoichev • Former colleagues • John McGinley, Huiling Yuan, Brad Beechler, Brent Shaw, etc • Long list of collaborators, visitors, etc
LAPS Cloud analysis C&V / Icing METAR METAR METAR OAR/ESRL/GSD/Forecast Applications Branch 5
Some LAPS / STMAS History 1989 - Wind Analysis Developed, Radar remapping of V,Z 1991 - Cloud Analysis / hot start developed and tested in the WISP experiment (with NCAR) 1992 - T-LAPS installed at 40 ITWS sites using Doppler Winds 2000s - Cloud analysis / hot start elements subsequently appeared in the cycled RUC running at NCEP 2006 - STMAS surface analysis developed & tested at MIT/LL for CoSPA 2009 - STMAS 3-D analysis developed 2-km resolution every 5-min by 1998 Compare with national 2-km by ~2013 STMAS (state vars + clouds) → GSI → HRRR in future? OAR/ESRL/GSD/Forecast Applications Branch 6
Cloud Analysis Flow Chart Cloud Fraction 3-D Isosurface
Satellite use in Cloud Analysis (GOES / SEVIRI) • 11 micron IR • 3.9 micron data • Visible (with terrain albedo database) • CO2-Slicing method (Cloud-top pressure) OAR/ESRL/GSD/Forecast Applications Branch 8
Cloud / Reflectivity / Precip Type (1km analysis) Obstructions to visibility along approach paths DIA
Analyzed Cloud Liquid vs WISP Aircraft measurements Envelope Indicates Good POD Scatter (FAR) due to unresolved small-scale LWC variability, otherwise good analysis of icing potential OAR/ESRL/GSD/Forecast Applications Branch 10
Vertical motion and Hot-Start LAPS hot-start scheme Dramatically improves Very short-range forecast, Importance to terminal Scale forecasts The hot-start scheme will be adapted into STMAS, a multi-grid variational data assimilation system with satellite, radar, conventional obs and model dynamic constraint applied simultaneously.
Cloud vertical motion for LAPS developed at FAB and Taiwan CWB Dependence on cloud type, Updraft goes to top of cloud CS Strongest updrafts in regions of high reflectivity CB Downdrafts below freezing level Randomness in broad convective regions 0C OAR/ESRL/GSD/Forecast Applications Branch 12
Initialization 5 min forecast Illustration Hot Start Clouds + vertical motion Cloud Insertion only Cloud liquid (shaded), vertical velocity (contours) and cross-section streamlines for analyses (right) and 5-min forecasts (left). The top pair shows LAPS hot-start DI with upward vertical motions where clouds are diagnosed and properly sustained cloud and vertical motions in the forecast; the bottom pair demonstrates the artificial downdraft that usually results from simply injecting cloud liquid into a model initialization without supporting updrafts or saturation. Note that cloud liquid at the top of the updraft shown in the hot-started forecast (above right) has converted to cloud ice.
CloudSat Verification of LAPS Cloud Analysis LAPS CloudSat
6-hr Diabatically (LAPS) initialized WRF-ARW forecast Lin μPhys Analysis 13 June 2002 Developing Squall Line at Initial Time
Bias & ETS June 13 2002 Large Sensitivity in Bias to Variations in Microphysics ETS values are highest at early times due to hot-start
Analysis 3-hr Forecast, Lin μPhys 16 June 2002 Well-Developed Squall Line at Initial time
Bias & ETS June 16 2002 Low Sensitivity in Bias to Variations in Microphysics (developed squall line case) ETS values are highest at early times due to hot-start
850 mb Analyzed and Simulated Reflectivity Analysis 2hr HOT Fcst 2hr NO-HOT Fcst 16 June 2002
Future Cloud Analysis Recommendations • Higher Resolution Time/Space • Develop forward models for all data sources being used to more fully implement a variational approach • Incorporate variational formulation into STMAS & GSI (NCEP), via the DTC • Consider new data sources OAR/ESRL/GSD/Forecast Applications Branch 20
Thanks!!!! http://laps.noaa.gov
Cloud liquid / Temperature (5km analysis) Cloud Ice / Precipitating Ice also analyzed (not shown) DIA
Satellite Fog Dissipation • Relies on satellite visible imagery input to 4DVAR assimilation system • Useful for daylight determination of early morning “burnoff” of fog • IFR to VFR forecast timing • Can interface with the new CRTM visible channel satellite forward radiance model OAR/ESRL/GSD/Forecast Applications Branch 23
Temporal gradient assimilation with 4DVAR Fog t1 4DVAR assimilation Fog t2 Fog t3 Prior observations Fog t4 Forecast OAR/ESRL/GSD/Forecast Applications Branch 24